On this page
Open-source reconnaissance
Reading a structure's power starts with open-source intelligence (OSINT): the public records anyone can pull before going near the site. From these alone you can name the utility that feeds the building, find where the service enters, read how much it carries, and check whether it is energized.
The utility feeds the structure through a transformer, past the meter, to the main panel; the panel then divides that supply into the branch circuits that serve the building and, sometimes, into subpanels deeper inside.
Start in OpenStreetMap, a free public map anyone can query: it carries the electrical grid, where the power key covers “facilities for generation and distribution of electrical power,”34 tagged as power=line, minor_line, tower, pole, transformer, and substation.34 Module 04 used Overpass Turbo (overpass-turbo.eu) to query OpenStreetMap for salvage sites; the same tool queries the grid. Paste this, move the map over the target, and press Run.
[out:json][timeout:60];
(
  nwr["power"="transformer"]({{bbox}});
  nwr["power"="pole"]({{bbox}});
  nwr["power"="tower"]({{bbox}});
  nwr["power"="line"]({{bbox}});
  nwr["power"="minor_line"]({{bbox}});
  nwr["power"="substation"]({{bbox}});
);
out center;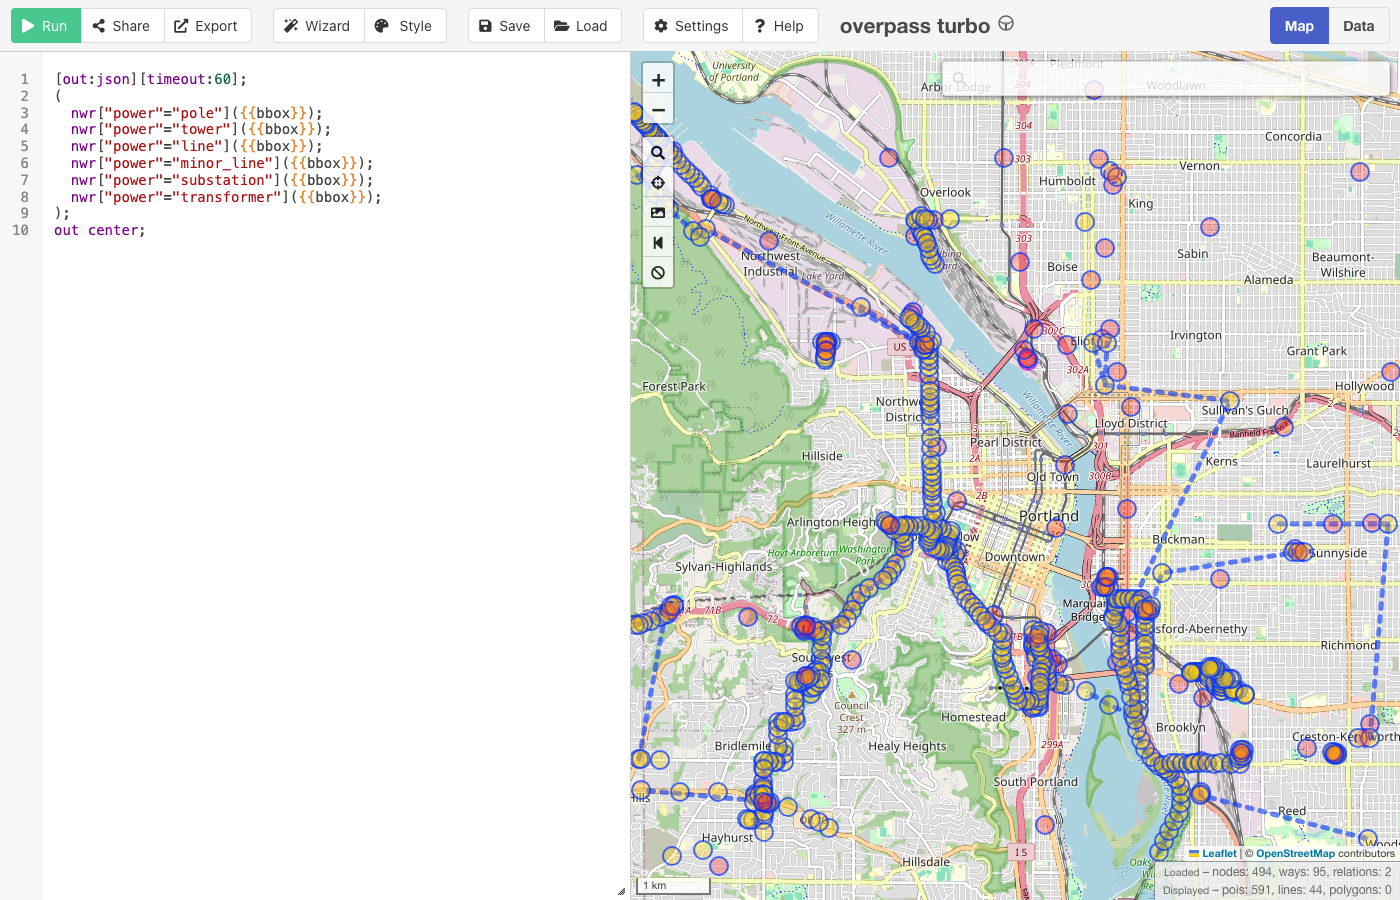
It plots poles, lines, transformers, and any substation, so you read which direction the feed comes from and whether it is overhead distribution or a nearby substation. Open Infrastructure Map renders the same data as a finished grid map: it is “a view of the world's infrastructure mapped in the OpenStreetMap database,” with all data “sourced directly from OpenStreetMap,”35 so you trace a substation along its distribution lines to the target without writing a query.
OpenStreetMap defines power=substation as “a facility which controls the flow of electricity in a power network with transformers, switchgear or compensators,”41 and its voltage tag records “the voltages of the substation, ordered from highest to lowest.”41 Read it in that order: the first number is the voltage coming in, the last the voltage going out. When run over inner Portland, the query returns Holladay Substation, operated by PacifiCorp, tagged substation=distribution with voltage=115000;12470:34 115 kV in, 12.47 kV out. That drop from transmission voltage to distribution voltage is the same one the next unit reads at the pole transformer; record both voltages before you go to the site. A substation tagged substation=transmission carrying a longer voltage list sits further up the chain and does not feed structures directly.
Querying by radius instead of map view narrows this from a city to one structure. Overpass provides an around filter that “selects all elements within a certain radius in metres around the elements in the input set,” and “if you provide coordinates, then these coordinates are used instead of the input set.”42 Give it a radius in meters, a latitude, and a longitude, and it returns only what stands near that point. The nwr at the start of each line is “shorthand for nodes, ways or relations,”42 so one line covers all three element types.
[out:json][timeout:90];
// everything electrical within 300 m of one point
(
  nwr["power"="pole"](around:300,45.5152,-122.6784);
  nwr["power"="minor_line"](around:300,45.5152,-122.6784);
  nwr["power"="transformer"](around:300,45.5152,-122.6784);
  nwr["power"="substation"](around:300,45.5152,-122.6784);
  nwr["power"="generator"](around:300,45.5152,-122.6784);
  nwr["man_made"="street_cabinet"](around:300,45.5152,-122.6784);
);
out center;
Ground-level utility boxes are mapped as man_made=street_cabinet, “a cabinet located in the street and hosting technical equipment to operate facilities such as electricity or street lights,”43 narrowed by utility=power to “a street cabinet use [sic] to host devices for electricity distribution.”43 On-site generation is mapped as power=generator, “a device which converts one form of energy to another, for example, an electrical generator,”44 with generator:source=solar naming the source. A structure with tagged generation has a second supply feeding its panel, covered in Unit 03.
Utilities publish live outage maps; use them to check whether a segment is energized without going near it. Florida Power and Light describes its map as “an online, interactive map that shows the location of any current power outages across FPL's service territory.”45 The limit is granularity, and the utilities state it themselves. FPL says that “for safety and security reasons, FPL's Power Tracker does not display outage information for specific street addresses.”45 Orange and Rockland states that “the outage symbol is placed at a center point on the map in relation to all customers affected by that outage,” so “one outage on the map may represent multiple homes and businesses,” and one “may cover several streets or, in case of major events, even miles,” with updates “every 15 to 30 minutes.”46
For the transmission end, the Homeland Infrastructure Foundation-Level Data program publishes “geospatial data sets containing information on Electric Power Transmission Lines” through data.gov as a United States government work.47 Confirm it is still live before relying on it: “in August 2025, HIFLD Open, a public data portal managed by the U.S. Department of Homeland Security (DHS), was shut down,” and its open datasets were preserved in the Homeland Security Digital Library instead.48
Many jurisdictions publish assessor and electrical-permit records, which give the year built and sometimes the service size and inspection history. They are the paper trail behind the panel's “APPROVAL FOR ELECTRICAL” sticker. Availability varies by jurisdiction, so do not count on them. Sanborn fire-insurance maps, public-domain and held by the Library of Congress,36 give a building's footprint and construction, but they were drawn for fire underwriting and predate electrification in many editions, so they do not reliably show electrical service. No open database holds the structure's internal wiring, its branch-circuit layout; you read that on site, at the panel.
Test the coverage rather than trusting it. OpenStreetMap is contributed, not surveyed, so coverage varies by area and feature: a live query over the same Portland area returned 230 poles and 20 substations but no individual distribution transformers, which are mapped far less often than the lines and poles carrying them. An empty result means nobody has mapped it, not that nothing is there. Read every open source as a lead to confirm on the ground.
Open-source reconnaissance cannot give you the state of the service: for that you go and look, still without touching anything.
Reading the power from outside
The service is everything that brings power from the utility to the building: “the conductors and equipment for delivering electric energy from the serving utility to the wiring system of the premises served.”24 It enters in one of two ways. In older and rural areas it comes overhead: high-voltage lines drop through a transformer to the property,17 then run down the wall in a conduit called the service mast, which caps at the masthead, or gooseneck, a fitting that acts “as a rain cap to stop moisture from entering the conduit” and protects the conductors where they enter.17 Newer areas bury the supply as an underground service lateral. Either way it reaches the meter, the utility's running count of energy in kilowatt-hours, and enters the panel.
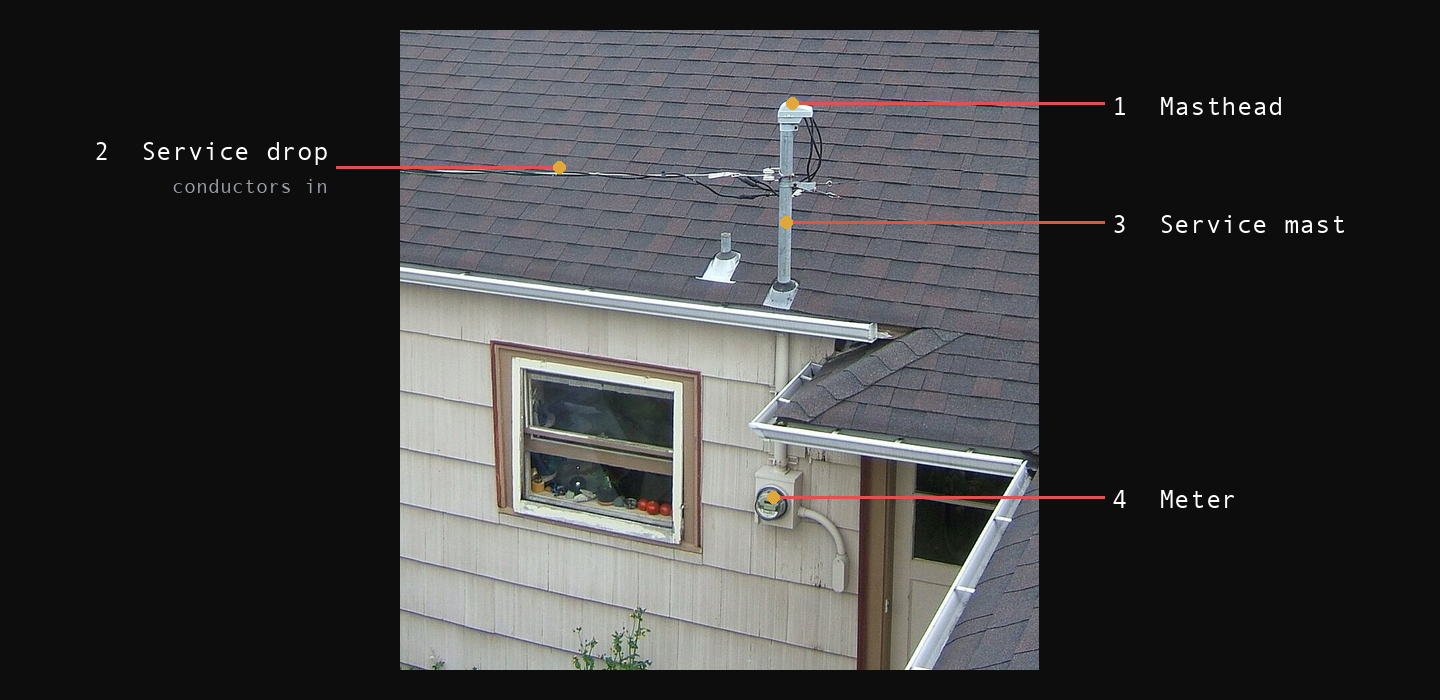
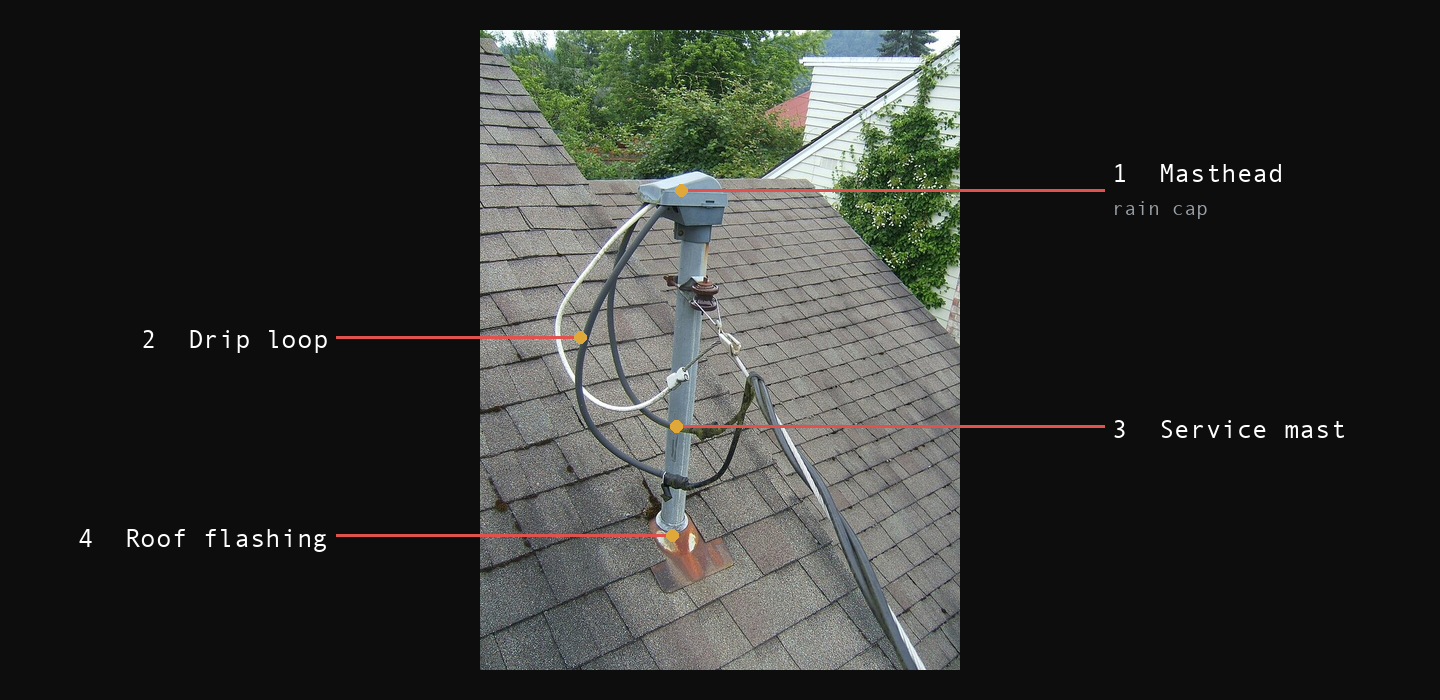


The service point divides the two sides: “the point of connection between the facilities of the serving utility and the premises wiring.”29 Everything upstream of it, the pole hardware or the pad, is the utility's equipment, carrying its voltages; the drop or lateral, the meter, and the service equipment are the premises side you read.
On a pole, the transformer feeding a structure hangs below the primary conductors, which run at medium voltage, typically 12 to 34.5 kV for local distribution.30 At a riser pole the protective hardware is visible from the ground: “transition points between aerial and underground sections (riser poles) will be provided with primary fuse cutouts and surge arresters.”30 The drop off that transformer is “the overhead service conductors from the last pole or other aerial support… connecting to the service-entrance conductors at the building.”29
Underground, the transformer is a pad-mounted box at ground level, and the buried lateral reaches the structure through handholes or pull boxes. That lateral runs “between the street main… and the first point of connection to the service-entrance conductors.”29 A service or meter pedestal stands away from the building it feeds; for a manufactured home the code sets that distance, requiring the service equipment be located “in sight from and not more than 9.0 m (30 ft) from the exterior wall of the mobile home it serves.”31
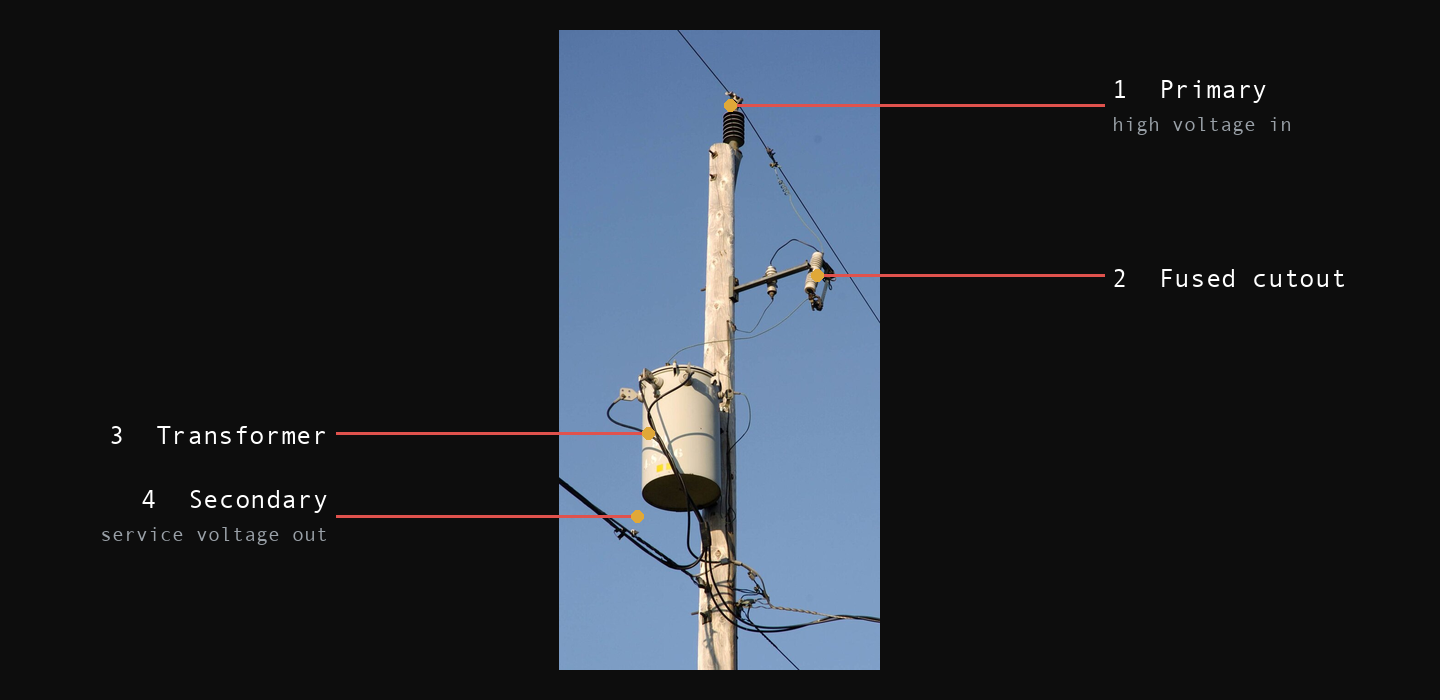
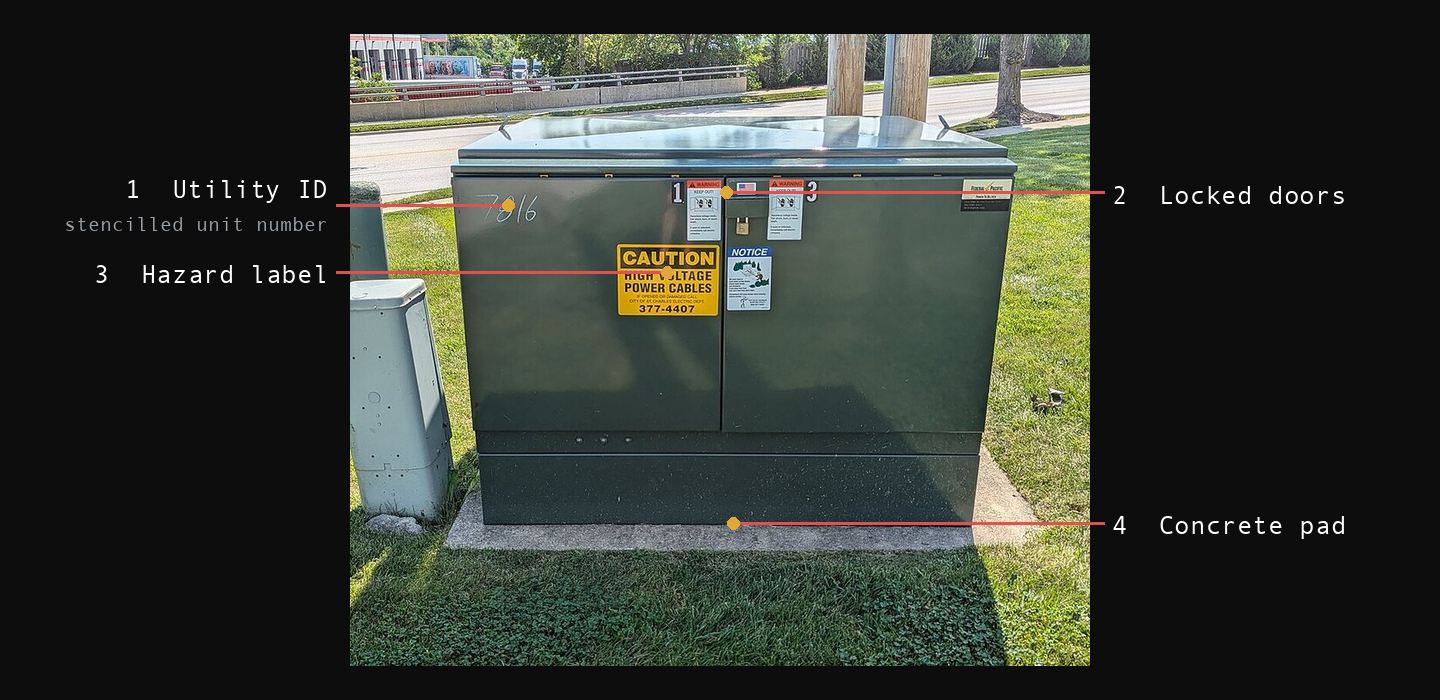


“All lines are considered energized until they are completely disconnected and isolated from all electrical power sources,”25 and the medium-voltage side is beyond a lay operator: “work on energized lines or equipment operating at 17,000 volts and above… is not recommended.”25 Identify the pole or pad to tell an overhead service from an underground one and to locate the service point; keep clear of the primary side.
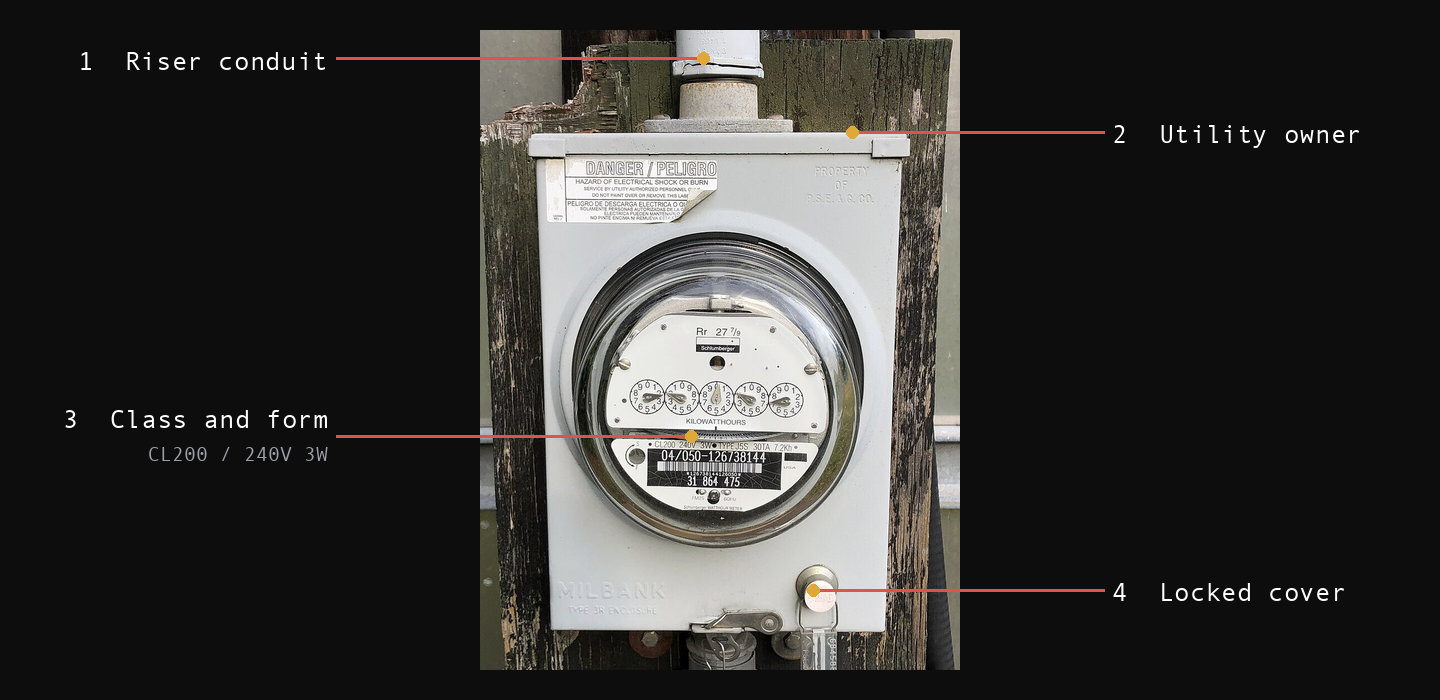
You read whether a structure is drawing power before opening anything. A fire-service procedure for evaluating a vacant building makes this the first step: “during the exterior survey, observe the status of utility meters and valves on the outside of the building,” to determine “if there is electricity and water available.”32 The meter is the clearest sign. An older electromechanical meter has a spinning aluminum disc that turns “at a speed proportional to the power passing through the meter,” and a fixed amount of energy passes with each revolution, the meter constant Kh, given “in units of watt-hours per revolution.”33 A turning disc means current is flowing; a still disc means little or none. The Kh constant is printed on the nameplate: 3.6 watt-hours per revolution on the Westinghouse below. A newer smart meter replaces the disc and dials with a digital register reading a cumulative total, and records consumption in intervals as fine as 15 minutes that it reports to the utility.20 Neither meter shows present demand as a number, so a turning disc is the only live reading on the glass.
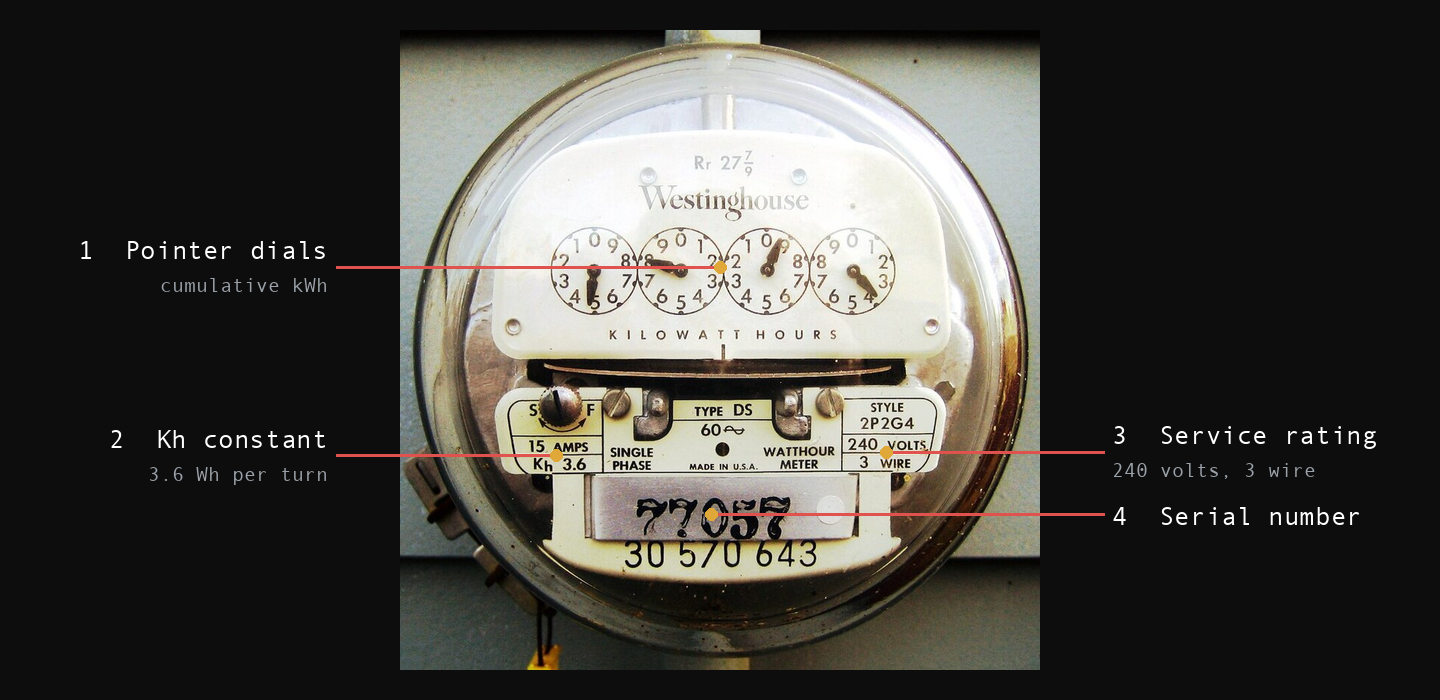
- Pointer dials. A running total of energy, read left to right. Not present demand.
- Kh constant. Watt-hours per turn of the disc. This meter, 3.6.
- Service rating. 240 volts, 3-wire: the split-phase supply (Unit 03) the panel divides.
- Serial number. Identifies this meter to the utility.

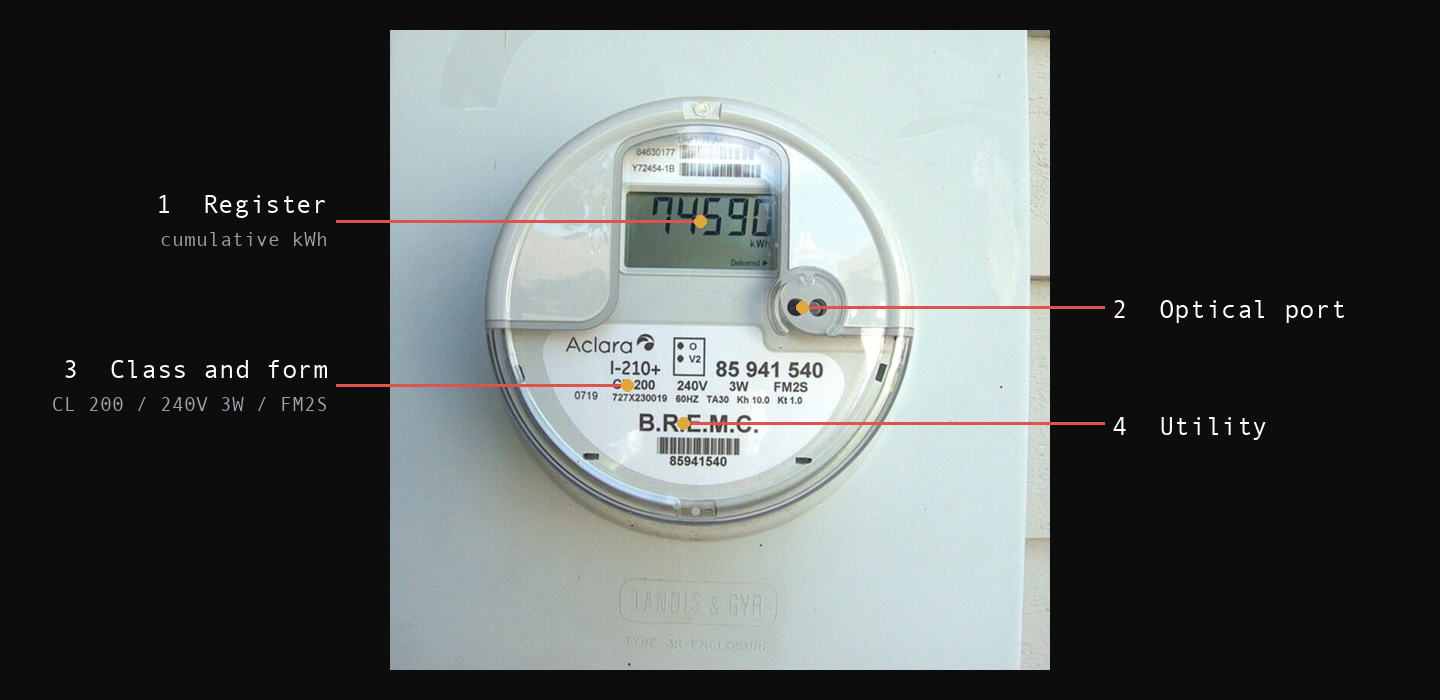
- Register. A running total of energy delivered, not what the building draws now.
- Optical port. The local read point. The same data also leaves this meter over the air, on 902 to 928 MHz, the signal Unit 07 identifies.
- Class and form. The meter’s own current rating and socket form, not the service size. The service rating is set by the main disconnect, read in Unit 03.87
- Utility. Names the operator, which you look up to find the tariff, the outage map, and the service territory.

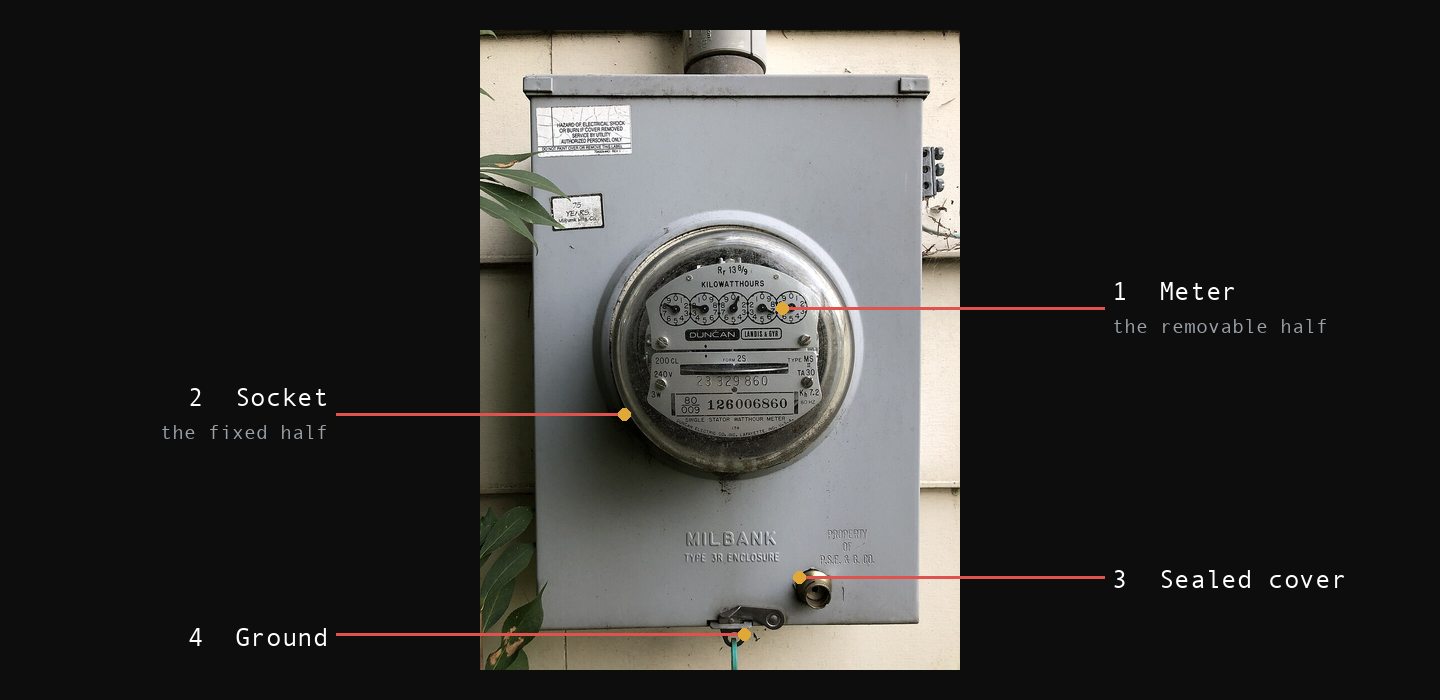
A drop still in place from the transformer to the masthead, or a lateral running from the pad to the structure, means the utility feed is connected. Whether the meter is seated in its socket or the socket stands empty is another sign. Utility practice on disconnecting a service varies, so an empty socket, a dark display, or a still disc is a reason to confirm, not proof the service is dead. Treat the service as energized until it is proven disconnected and isolated.25

_in_the_Mountainview_section_of_Ewing_Township,_Mercer_County,_New_Jersey.jpg)
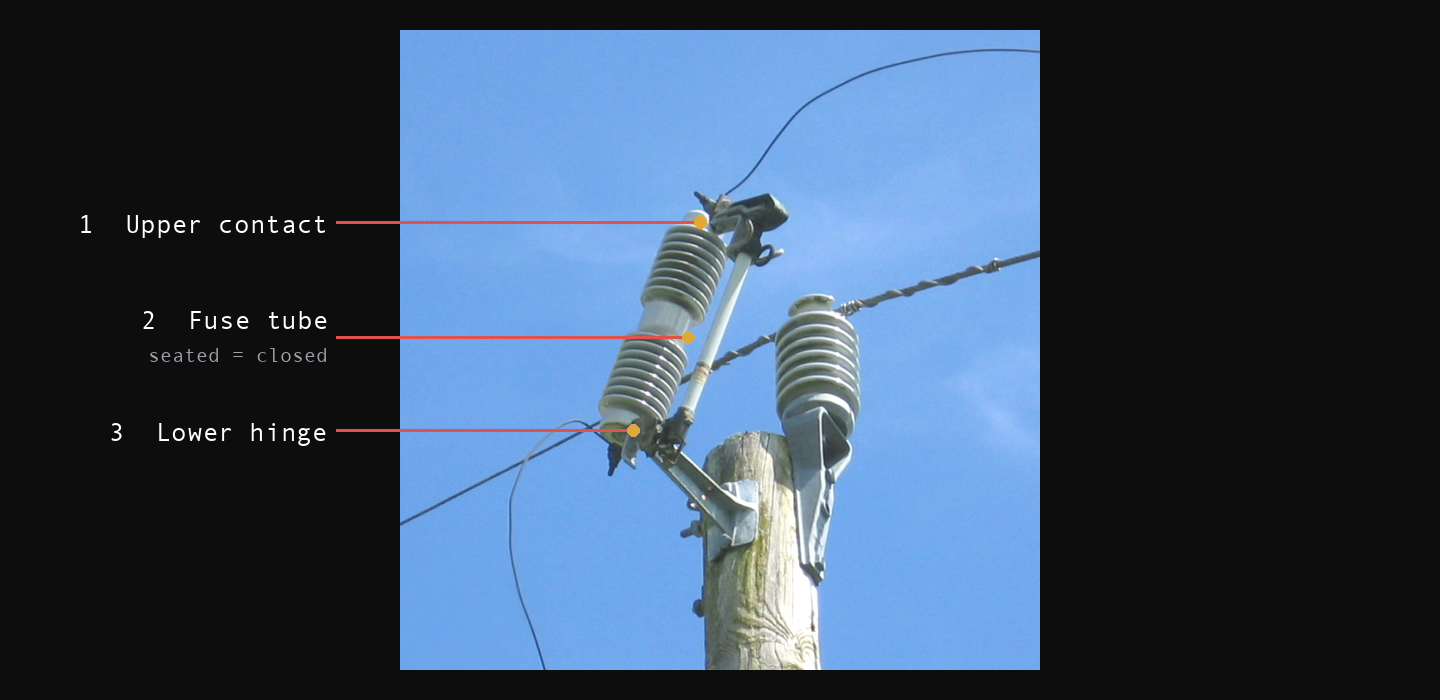
The fuse cutout on the pole reads from the ground as well. A cutout is a protective device on the primary side, its rating set by the current “necessary for equipment or feeder protection.”30 An open-type cutout carries its fuse in a hinged holder that bridges two contacts, and from the ground you read its position: a seated holder is closed and in service, and a blown fuse drops the holder open so it hangs down. Because the cutout sits in the same line as what it protects (in series with it), an open one means that circuit is interrupted at the pole.

Reading the panel
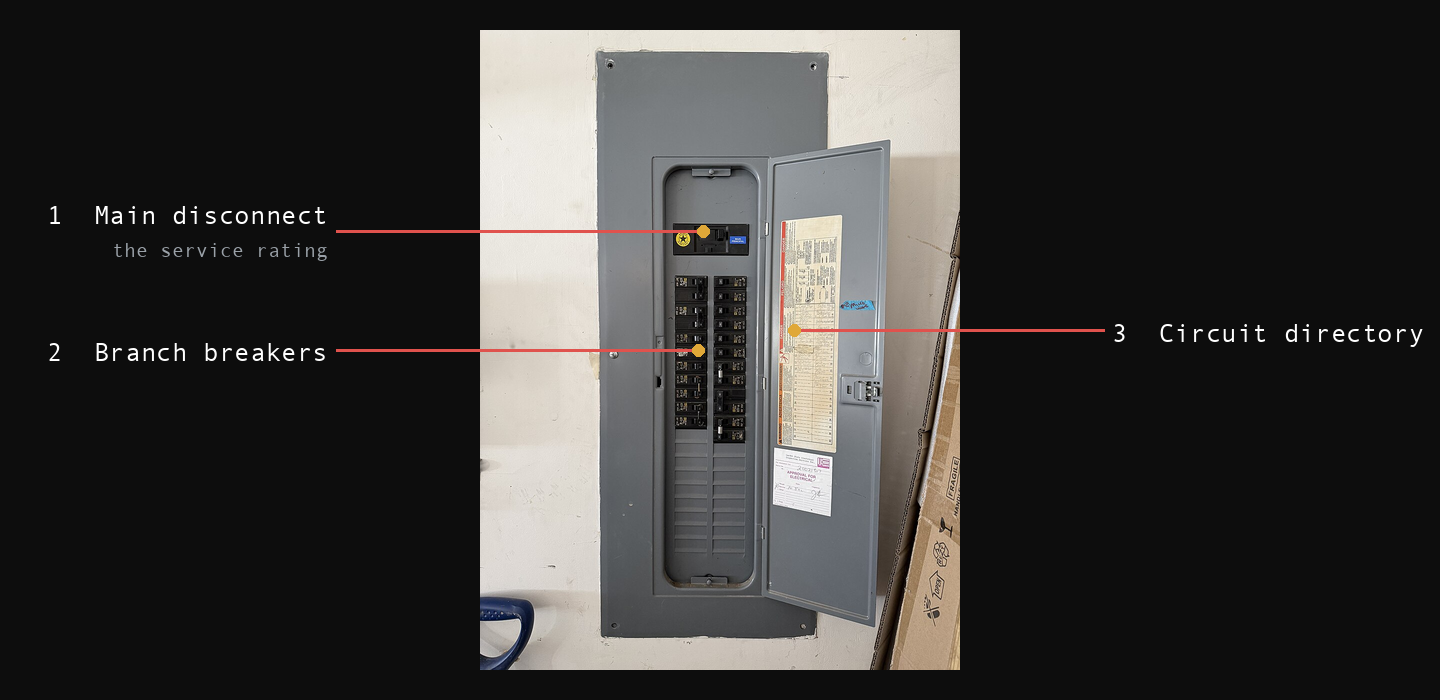

The main disconnect, the single breaker or switch that cuts all power to the panel, sets the size of the service. Its amperage is stamped on it or printed on the panel label, and that number is the ceiling on everything the building draws at once; an inspector reads “the main service disconnect's amperage rating, if labeled” first.3 Residential services commonly run from 100 to 200 amperes.17 The floor for a one-family dwelling is 100: “For a one-family dwelling, the service disconnecting means shall have a rating of not less than 100 amperes, 3-wire,” with 60 amperes the floor for other installations and 15 or 30 for one- and two-circuit services.1 When the main is not labeled, read the size from the service-entrance conductor, because “for larger amperages, we need larger conductors”:17 a 200-ampere service runs 2/0 copper (or 4/0 aluminum), a 100-ampere feed 3 AWG copper.17
Most homes take a 120/240-volt service, where “the cable assembly is made up of two ungrounded (live or hot) conductors, each supplying 120 volts, and one neutral or grounded conductor acting as the return.”17 Either hot leg to the neutral is about 120 volts and runs the lights and outlets; the two hot legs across each other are about 240 volts and run the range, the dryer, and the other large loads. The transformer makes both by tapping the center of its secondary winding: the center tap is the grounded neutral, each half of the winding is one 120-volt leg, and the two legs across the whole winding are 240 volts. The amperage rating is how much the two legs carry together.

From the main disconnect the panel divides the service into branch circuits, each protected by its own breaker, and the breaker rating is the circuit rating. Branch circuits “shall be rated in accordance with the maximum permitted ampere rating… of the overcurrent device,” and those ratings are “15, 20, 30, 40, and 50 amperes.”2 A 15- or 20-ampere breaker feeds general lighting and receptacles; 30, 40, and 50 feed larger fixed loads. The breaker opens the circuit on overcurrent: “overcurrent describes a condition in which a circuit is carrying more than its rated load of amperes,” and fuses, circuit breakers, and GFCIs are the devices that prevent it.4 That rating sets the circuit's ceiling, and the spare capacity left below what it already carries is the circuit's headroom. The code sizes a circuit with a margin for steady loads: the overcurrent device rating “shall not be less than the noncontinuous load plus 125 percent of the continuous load.”15 A continuous load should stay at or below 80 percent of the breaker rating, so a 20-ampere circuit holds about 16 amperes of steady draw.


A ground-fault circuit interrupter (GFCI) disconnects “a circuit when unbalanced current is detected between an energized conductor and a neutral return conductor,” the leak that would flow through a person,18 and the code requires it on outlets in bathrooms, outdoors, unfinished basements, kitchens, and other wet or grounded locations.16 An arc-fault circuit interrupter (AFCI) works “to de-energize the circuit when an arc fault is detected,”16 protecting the wiring against arcing. Both are still breakers, and you read them the same way. Some slots hold two thin tandem breakers instead of one, so count the circuits, not the slots.
A subpanel is a second panel fed from the main. “A service panel that does not contain the disconnect is called the distribution panel,”17 and it sits elsewhere in the structure: a garage, a basement, an addition. When the directory marks a feed for a remote distribution panel,17 find it and read it too. A structure's power is the main panel plus every subpanel it feeds.
Some structures are not powered only from the grid: on-site generation (solar, a battery, or a generator) feeds the panel through an inverter, a transfer switch, or a backfed breaker. Where interconnected sources are present, “a permanent plaque or directory, denoting all electrical power sources on or in the premises, shall be installed at each service equipment location,”22 so the service equipment itself should name what else feeds it. A generator ties in through transfer equipment, required to be “designed and installed so as to prevent the inadvertent interconnection of normal and alternate sources of supply,”23 and an optional standby system is intended to “supply on-site generated power to selected loads.”23 The transfer switch “usually controls a sub-panel, which feeds a few circuits for lights, outlets, and critical appliances.”21 Whatever ties in this way stays live even when the grid goes down. This unit reads the common case, a single-family, grid-fed, 120/240-volt residential service;17 commercial and multi-unit buildings take heavier, often three-phase services, which you read with more legs and more panels.
To follow a circuit from the panel to where you would use it, read the wiring method. Conduit comes in a few identifiable types: rigid steel, thin-wall steel tubing (EMT), PVC, and flexible metal.5 The type and its route tell you where a circuit runs and where you can reach it.

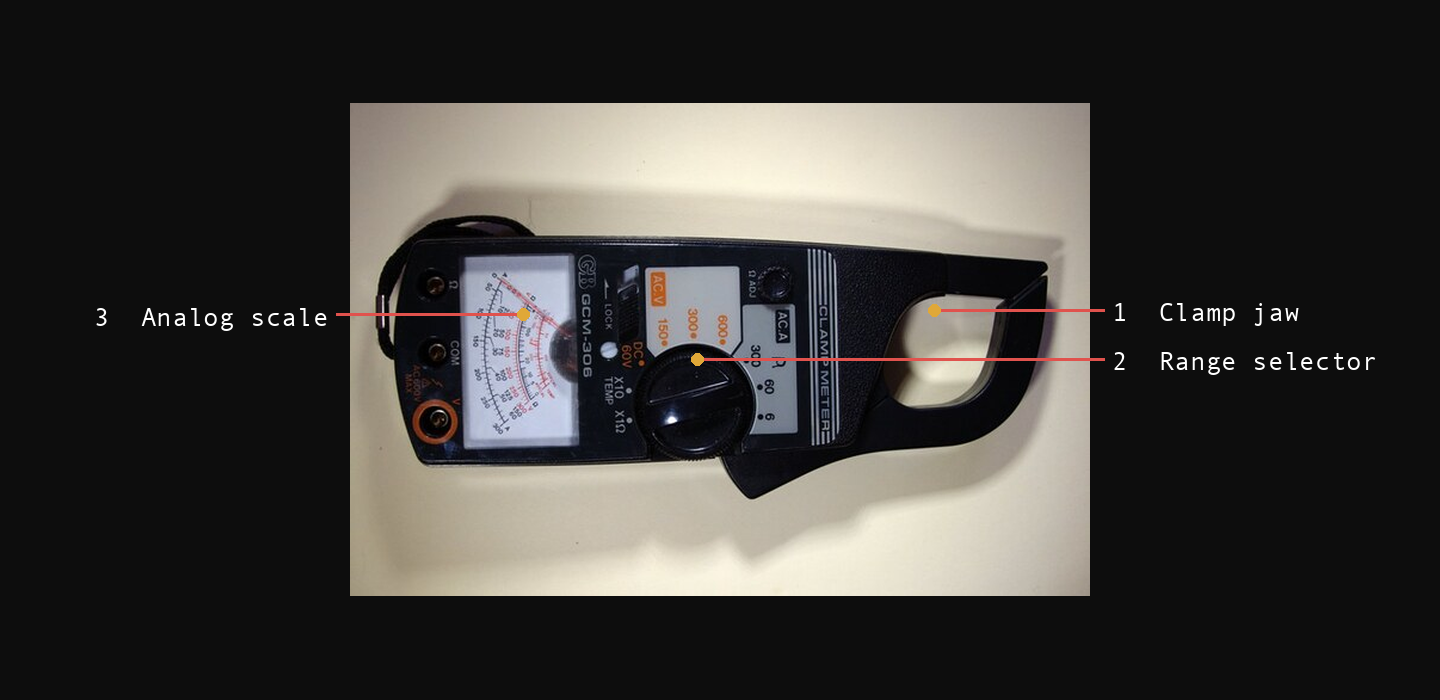
To size a real draw you measure the current a circuit carries, not the breaker number, with a clamp meter. A clamp meter “integrates a basic digital multimeter with a current sensor,” and you “open the clamp by pressing the trigger and carefully encircle one of the wires in a circuit without touching it directly,” a non-contact measurement.7 The jaw is a current transformer: the hinged ferrite-iron jaws close into a ring that concentrates the magnetic field around the conductor, a coil wound on that core is the secondary winding, the conductor inside the jaw is the single-turn primary, and the induced current is scaled down and shown as amps.7 Clamp one conductor only, never a whole cord, or the line and neutral currents cancel out.

A tap point is an accessible connection to a branch circuit that has headroom. Which points you can use depends on your access:
- From outsideYou can reach GFCI-protected receptacles, which the code requires outdoors,16 the meter base on the exterior wall, and any disconnect mounted outside.
- From insideYou can reach every receptacle, switch box, junction box, and subpanel17 on a branch circuit, including interior circuits that are out of reach from outside, such as a bedroom's receptacles or a closet subpanel.
What is hardwired with no receptacle, a furnace or a dedicated 240-volt appliance run, is not a tap from either side. A breaker with headroom and a reachable point make a usable tap only when both are on the same circuit; confirm that by switching the breaker off and noting which receptacles and fixtures lose power.
Everything downstream of the meter is the load side, and current drawn there passes through the meter and adds to its count. A tap ahead of the meter, on the supply side, draws current that never passes through it, so nothing registers, though it is on the utility's conductors.
A tap can be detected three ways:
- Protective devicesA draw over the circuit's continuous limit trips the breaker;15 current that returns on a path other than the neutral trips a GFCI.18
- The meterSmart (AMI) meters “record kilowatt-hour (kWh) consumption in intervals as fine as 15 minutes,”20 so a load-side tap shows as a step in the recorded profile. Keep the draw small against the structure's normal swing, the ordinary rise and fall of its power use through the day; a supply-side tap shows nothing at the meter.
- The supplyA switch-mode supply pushes radio-frequency noise back onto the wiring; the FCC caps “the radio frequency voltage that is conducted back onto the AC power line … within the band 150 kHz to 30 MHz.”19 A worn or uncertified switch-mode supply is noisy both on the powerline and across the radio-frequency spectrum that the next unit surveys; a clean supply, whether a linear (non-switching) type or a battery, is quiet.

Put the reads together into one pass over a structure:
- Find the meter. Outside, note whether the service comes in overhead (down a mast to the masthead) or underground.
- Read the main disconnect. At the panel, with the dead front on, read its amperage. When it is not labeled, infer the size from the service-entrance conductor gauge.
- Read the directory. Note which breakers feed what, and each breaker's rating.
- Find the subpanels. Follow any feed marked for a distribution panel and read that panel the same way.
- Measure a draw. With a clamp meter set to amps AC and a line splitter, clamp one conductor of a running load and read the amps it carries.7 The reading rises when the load turns on and falls when it turns off.
- Compute the headroom. Take 80 percent of the breaker's rating as the continuous limit, then subtract the measured draw.
- Locate the tap points. Given your access, list the reachable points that sit on circuits with headroom: from outside, exterior receptacles and any outside disconnect; from inside, receptacles, junction boxes, and subpanels. Confirm a point and a breaker are the same circuit before you count it.
- Check it blends in. Keep the tap under the 80 percent limit and on one hot-and-neutral pair, so no breaker or GFCI trips; keep the steady draw small against the structure's normal swing, so it does not step up an interval-recording meter; and use a clean supply, so it adds no powerline or RF noise.
- ReadThe main disconnect is rated 200 A, the circuit's breaker 20 A, and the clamp meter reads 6 A with the load running.
- Circuit limit20 A × 0.8 = 16 A continuous.
- Circuit headroom16 A − 6 A = 10 A left on this circuit.
- ServiceThe two legs together stay well under 200 A, so the service ceiling is not the limit here.
- ResultA steady draw of a few amps fits under the 10 A circuit headroom and the 200 A ceiling. It neither trips the breaker nor stands out.
Tapping the supply
With a point chosen and its headroom known, the tap is the connection itself: matched to the circuit, sized and protected for what it draws, and isolated from the utility. There are two ways to connect: plug into a receptacle, or splice into a box.
Make the tap in this order:
- De-energize it, or plug in. At a receptacle you plug in and open nothing. To wire into a box or a fixture, switch the circuit off at its breaker and confirm it carries no voltage: “all lines are considered energized until they are completely disconnected and isolated from all electrical power sources,” so an “approved voltmeter, scope meter, or voltage detector must be used for this test.”25
- Match conductor to conductor. Join hot to hot, neutral to neutral, ground to ground, with “splicing devices identified for the use”; the joint is covered “with an insulation equivalent to that of the conductors,”26 and the splice goes inside a box.27
- Size your own conductor. Your tap's cord or wire carries the current, so size it to the load; conductors are “protected against overcurrent in accordance with their ampacities.”28
- Fuse the tap. Put an overcurrent device in series with your hot leg, rated to your conductor and load. Fuses “become part of the circuit when installed in series with the hot wire,” and the element sets how much current passes before it opens.4
- Never back-feed. Do not energize the premises wiring or the utility side from your own source. A generator connects only through transfer equipment, “designed and installed so as to prevent the inadvertent interconnection of normal and alternate sources of supply.”23
- Stay under the headroom. Hold the draw under the circuit's 80 percent limit and the service ceiling you read, so no breaker or GFCI trips and nothing steps up on the meter.
The taps so far are load-side and reachable: a receptacle, a box, or a subpanel on a branch circuit, all downstream of the meter and inside the building. Reaching power from the outside is the harder case, and two things set its limits: which side of the meter you are on, and which voltage you are near.
Only the secondary side is approachable. The service drop, the service-entrance conductors, and the meter run at 120/240 volts, the same as the branch circuits inside. The primary side, which includes the pole lines, the transformer's high side, and the cutouts, runs at medium voltage, typically 12 to 34.5 kV for local distribution.30 It is lethal and utility-only, as Unit 02 established, and nothing on it is ever a tap.
A connection made ahead of the meter is a supply-side connection, and the code treats that location as a special case. Only a closed list of equipment is “permitted to be connected to the supply side of the service disconnecting means,”37 and that list is meters, current-limiting devices, instrument transformers, and specific standby and interconnection taps, not a load. A load drawn there is outside what the code permits, and because it sits ahead of the meter it is unmetered: the current never passes through the meter's counting register. It is also more dangerous than a load-side tap, because no breaker sits between you and the transformer, so the conductors are live and their current is unlimited, and they stay energized until proven isolated.25
Reaching an exterior drop or service point can mean working at height and near live conductors, and the hazard order there is fixed: the fall first, the voltage second. Above four feet on a pole or tower, fall protection is required, not optional: “each employee in elevated locations more than 1.2 meters (4 feet) above the ground on poles, towers, or similar structures shall use a personal fall arrest system, work-positioning equipment, or fall restraint system.”38
The standard for electrical protective equipment covers “rubber insulating gloves” among the rest,39 and rates each glove by class to a maximum use voltage:
| Glove class | Maximum use voltage, ac |
|---|---|
| Class 00 | 500 V |
| Class 0 | 1,000 V |
| Class 1 | 7,500 V |
| Class 2 | 17,000 V |
| Class 3 | 26,500 V |
| Class 4 | 36,000 V |
For 120/240-volt secondary work, Class 00 or Class 0 covers the voltage. The higher classes exist because line crews work on energized medium voltage with training, testing, and rescue backup that a lay operator does not have, and a glove's class rating supplies none of those things. “Under-rated protective equipment should not be used,”25 and no glove makes the primary side approachable.
The Dolos platform is a small computer that senses, communicates, and acts, and a sensor or comms node built on it draws very little. A Raspberry Pi Zero 2 W idles at about “100 mA (0.6 W)” with its video and status LED off (third-party measured),40 a few hundredths of an amp at 120 volts. Against a branch circuit with several amperes of headroom, that draw fits under the 80 percent limit with room to spare and stays inside the structure's normal swing, so an interval meter does not step up on it. Read the service, size the headroom, and make the tap under it; the structure's own power then runs the node. Dolos is one platform that fits there, not the only one; size any load the same way, against the headroom you read.
Reading the spectrum
In the United States every frequency is allocated to a service, and those allocations are published in the FCC's Table of Frequency Allocations,59 so you know before you arrive what each band is assigned to carry. Reading the spectrum at a site is an inventory, not a discovery: you go to find which of those allocated bands are actually in use, how strong they are, and how constant.
| Band or service | Frequencies | Notes |
|---|---|---|
| HF | 3 to 30 MHz | Long-range traffic. Amateur here: 14.000 to 14.350, 21.000 to 21.450, 28.000 to 29.700 MHz.63 |
| FM broadcast | 88 to 108 MHz | “FM broadcasting stations.”59 Continuous, so a useful reference for confirming a receiver works. |
| Aeronautical | 108 to 137 MHz | VOR 108.000 to 117.950, ILS localizer 108.100 to 111.950, ATC voice 118.000 to 121.400 / 132.025 to 135.975 / 136.000 to 136.400 MHz, 25 kHz spacing; 121.500 “emergency and distress.”60 Amplitude-modulated. |
| VHF land mobile | MURS: 151.820, 151.880, 151.940, 154.570, 154.600 MHz | Business and public-safety traffic; MURS needs no license.62 |
| Marine VHF | 156.275 to 157.450, 161.575 to 162.025 MHz | Maritime service, heard mainly near the coast and on navigable rivers.61 |
| Amateur VHF and UHF | 50 to 54, 144 to 148, 222 to 225, 420 to 450, 902 to 928, 1240 to 1300 MHz | Repeater output on 2 m and 70 cm is a constant carrier when active.63 |
| Public safety | VHF, UHF, 700 and 800 MHz | Public Safety Pool under the private land mobile rules;65 much of it on digital trunked systems.55 |
| FRS | 462.5500 to 462.7250, 467.5625 to 467.7125 MHz | Twenty-two channels; license-free consumer handhelds.62 |
| Unlicensed | “902-928 MHz, 2400-2483.5 MHz, and 5725-5850 MHz.”64 | Wi-Fi, Bluetooth, cordless devices, and most cheap telemetry. |
An allocation says what a band is for, not what is on it at your site. A rural fire frequency and a downtown trunked system are both Part 90; only one of them is likely to be active where you stand.
Every location has a noise floor, the background level of radio energy that sits beneath the individual signals. In a city that floor is raised by man-made noise, and the amount is not uniform. The International Telecommunication Union (ITU) records this as a straight-line relationship. For a city location the median man-made noise figure follows Fam = 76.8 − 27.7 log f, with f in megahertz, valid from 0.3 to 250 MHz,6 and a separate formula for business areas continues into the UHF region as Fam = 44.3 − 12.3 log f for 200 to 900 MHz.6 Both formulas show the same trend: man-made noise is worst at the low end of the spectrum and falls as frequency rises. Worked once with the city formula: at 5 MHz, log 5 is 0.70, so Fam is 76.8 minus 27.7 × 0.70, about 57 dB; at 150 MHz, log 150 is 2.18, so Fam is 76.8 minus 27.7 × 2.18, about 17 dB. The same city is roughly 40 dB noisier at 5 MHz than at 150 MHz. In practice a quiet rural site sits “around −110 dBm,” while “in dense urban environments… the noise floor can be significantly higher, often ranging from −95 dBm to −80 dBm due to prevalent Wi-Fi, cellular, industrial, and other RF emitters.”67 A city location can therefore bury signals up to 30 dB fainter than a rural site would still detect.
Field guidance on urban radio states the problem directly: “radio communications in urbanized terrain pose special problems,” because “there is the problem of obstacles blocking transmission paths” and “the problem of poor electrical conductivity due to pavement surfaces.”66 VHF suffers most, because those sets “require a line of sight between antennas,” and “line of sight at street level is not always possible in built-up areas.”66 A band that is busy two streets away can read empty from a courtyard, so where you stand is part of the measurement, and one reading from one position does not describe the whole structure.
A sweep shows the two things you are reading for, what is occupied and what is open. Occupied spectrum is a strong, often constant return at a fixed frequency. Open spectrum is a quiet stretch sitting near the noise floor. A location's usable spectrum is the gap between the two.
The exact floor and the exact busy bands belong to the site and the time, so you do not take a number from a table; you measure. Sweep the bands at the structure, at more than one time of day where you can, and record the floor and the occupied ranges.
You read the sweep on a display of signal strength against frequency, the FFT, and its scrolling history, the waterfall, which “shows the same information… over time” so that intermittent traffic “show[s] up as a track of interrupted lines.”13 Bring the display's floor down until “the base noise floor… is brought down to the bottom” and the background flattens, and the weak signals stand out as brighter tracks against it.13 The tools below are the open ones that do this without a license or a subscription.
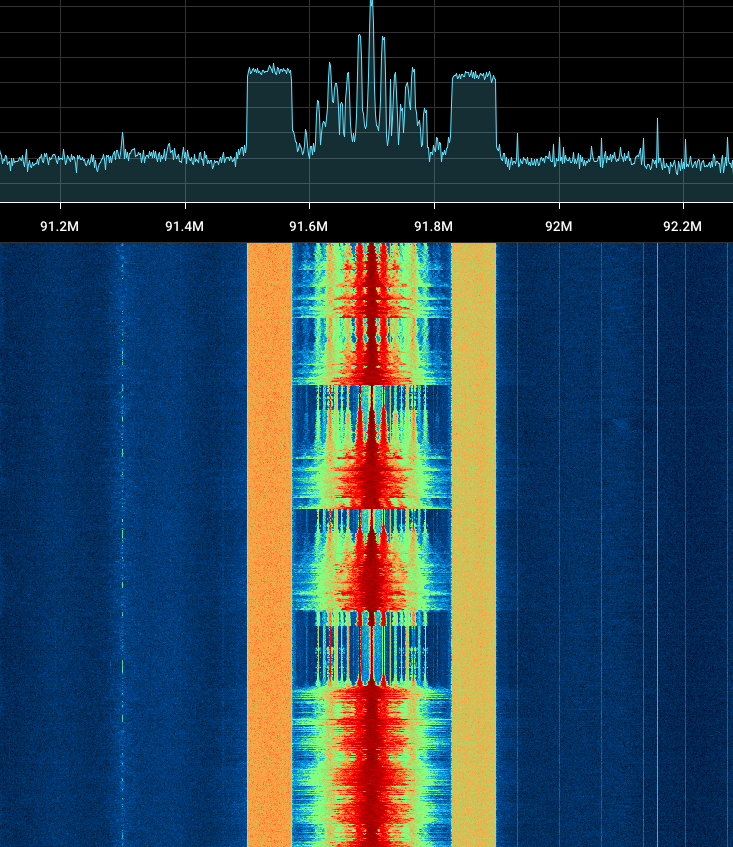

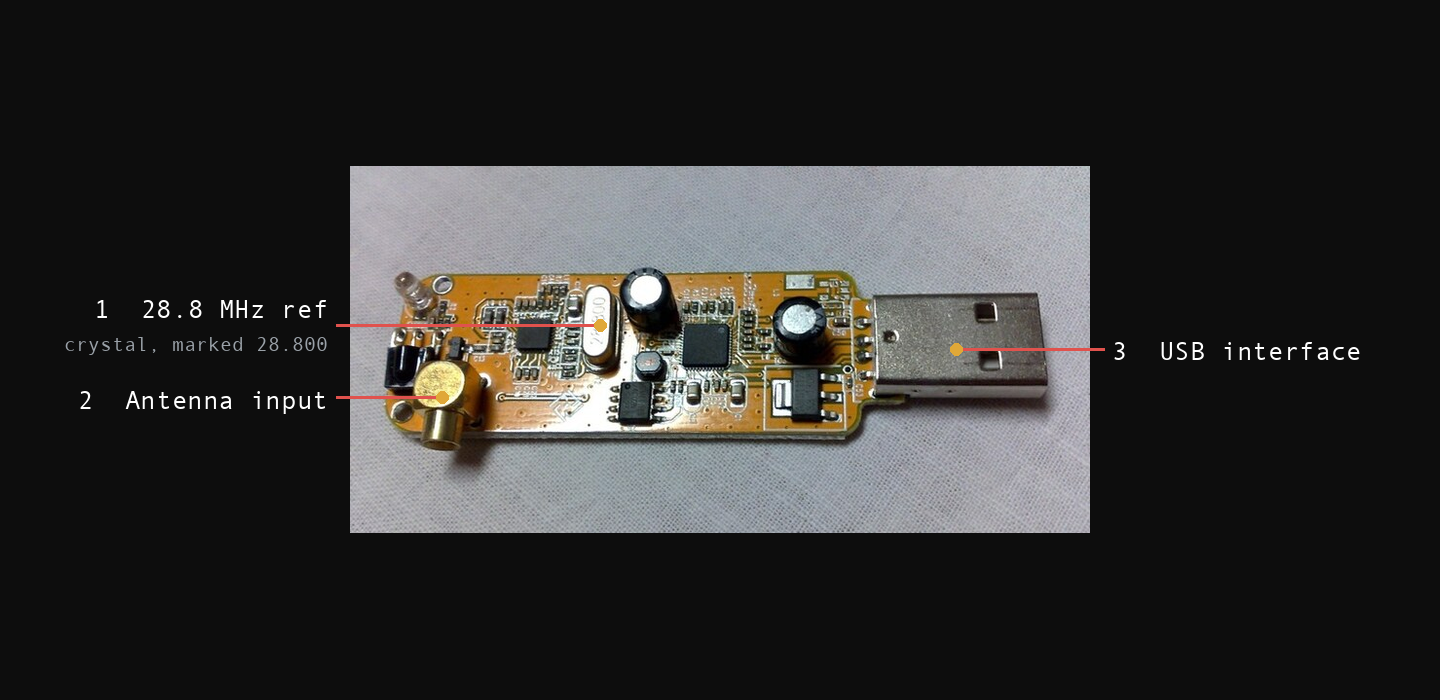
What a receiver buys you for survey work is instantaneous bandwidth and dynamic range. Instantaneous bandwidth is how much spectrum the device digitizes at once, so a receiver that takes 2.4 MHz has to retune many times to cover a band that a 56 MHz receiver captures in one pass, and every retune is time during which the rest of the band is unobserved. Dynamic range, set largely by the converter's bit depth, is how faint a signal you can still resolve while a strong one sits nearby, which is the ordinary condition in a city. A cheap dongle is enough to learn on and to find the obvious occupants of a band. It is slower and coarser when many signals crowd a band at once, which the receivers below handle better.
| Receiver | Tuning range | Bandwidth | ADC | Note |
|---|---|---|---|---|
| RTL-SDR V4 | “500 kHz to 1.766 GHz” | 2.56 MHz | 8-bit | The entry point; slowest to sweep a wide range.10 |
| Airspy R2 | “24 – 1700 MHz” | “10MSPS” | “12bit” | Four times a dongle's bandwidth, more dynamic range.71 |
| SDRplay RSPdx | “1kHz to 2GHz” | “up to 10MHz” | “14-bit” | Widest low-frequency reach of the mid tier.73 |
| HackRF One | “1 MHz to 6 GHz” | 20 MS/s | 8-bit | Wide reach, so range rather than resolution.11 |
| ANTSDR E200 | “70 MHz to 6.0 GHz” | “56M” | n/a | On a “ZYNQ XC7Z020” SoC; a whole band in one capture, over Ethernet.70 |
| USRP B200 | “70 MHz – 6 GHz” | “up to 56MHz” | n/a | The laboratory tier, priced accordingly.74 |
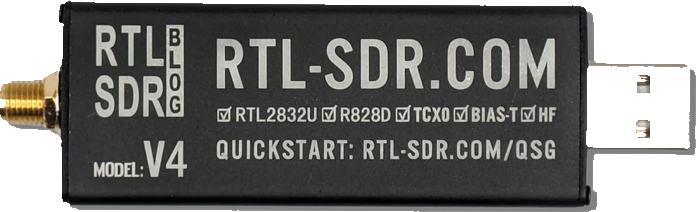
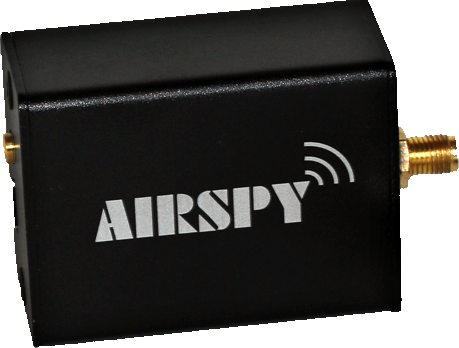
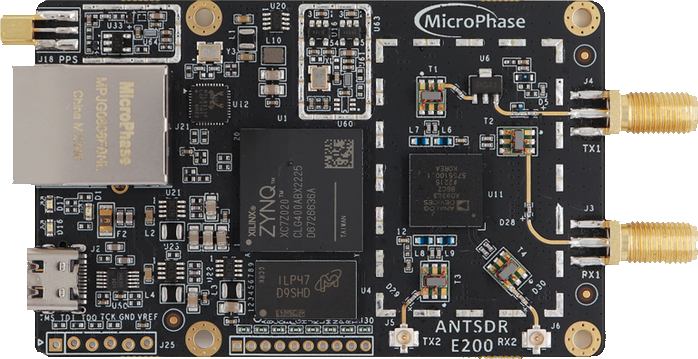
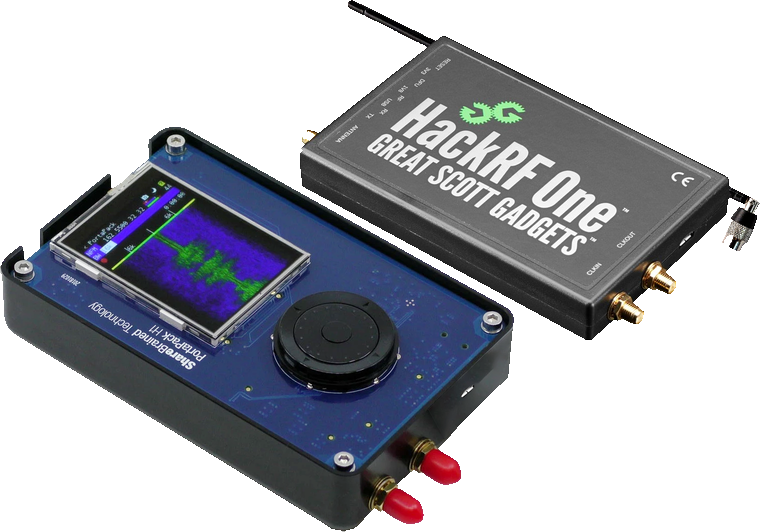
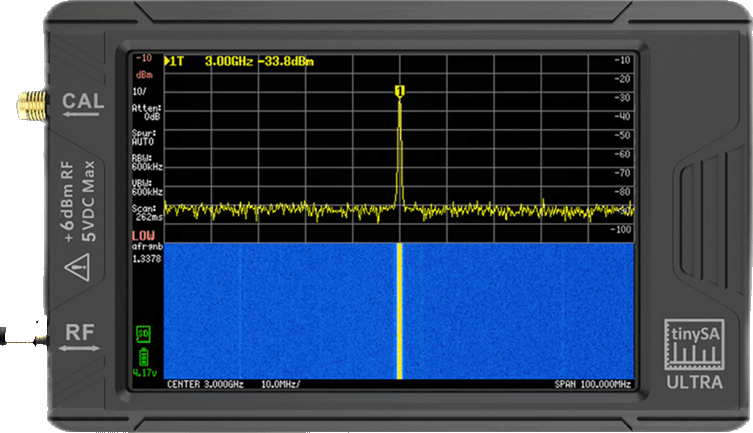
The survey method does not change with the hardware. soapy_power runs the same occupancy sweep this module uses on any supported device, obtaining a “power spectrum from SoapySDR devices (RTL-SDR, Airspy, SDRplay, HackRF, bladeRF, USRP, LimeSDR, etc.),”75 so a capture written for a dongle runs unchanged on better hardware and simply finishes sooner.
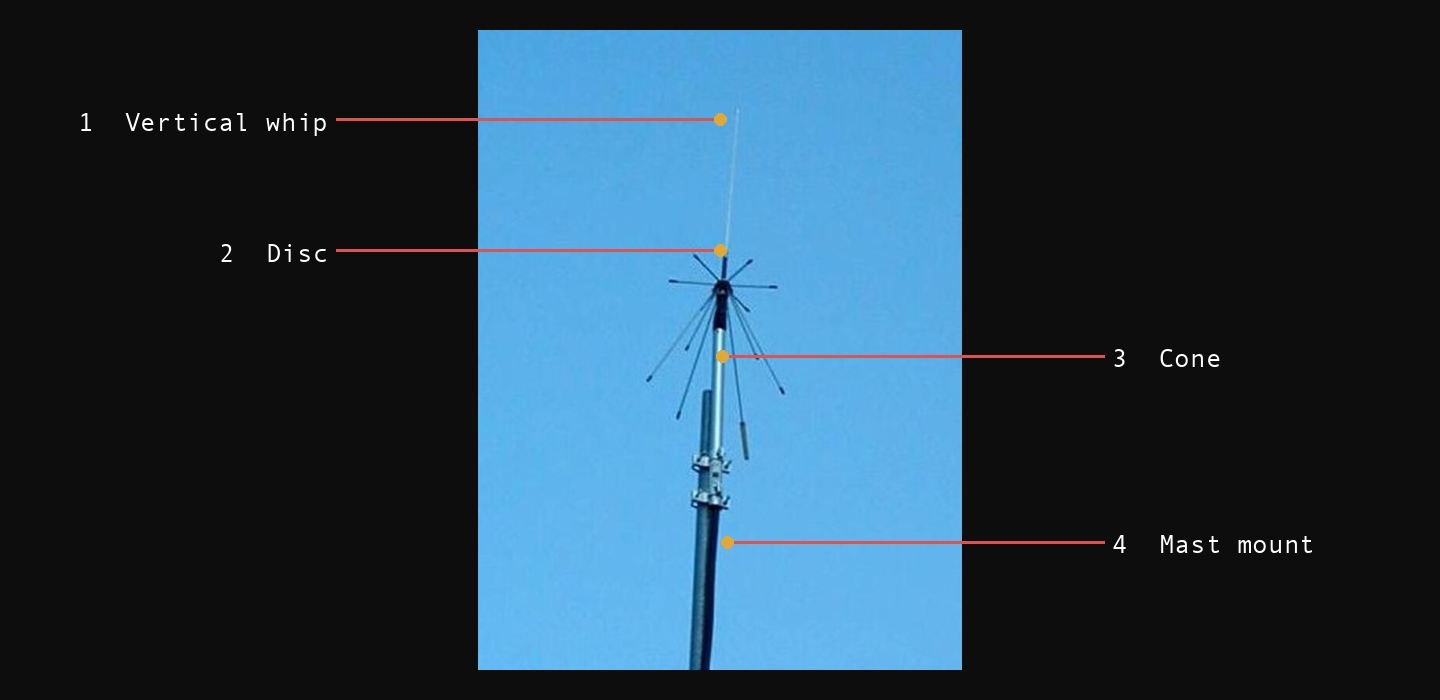
Anything of 50 ohms will connect: “any antennas and feeders with a resistance of 50 Ohm can be connected to the device through a standard SMA connector.”72 A wideband vertical such as a discone is the general-purpose choice for survey work because it receives across a broad range from every direction at once, which is what an inventory needs. A directional antenna receives further along one bearing and is what you reach for to locate a source rather than to survey. Orientation matters as much as type, because a transmission's waves are oriented a particular way, its polarization, and the antenna must be turned to match it: “by turning the antenna around the axis horizontally or vertically, you can achieve a significant improvement in the reception signal,” and the vertical position is the one to start from.72
.jpg)

Inventory one site. Work down the allocation list above at a single location, receiving only. Receiver operation itself (installing SDR++, selecting the device, tuning, and reading the spectrum and waterfall) is Module 06's field exercise; run that exercise first if you have not.
- Start at 88 to 108 MHz. A broadcast station you can identify confirms the receiver and the antenna work, so an empty result anywhere else means the band is empty.
- Work down the list. For each band record four things: the band, whether anything is present, the level of the strongest signal in it, and whether that signal is constant or intermittent.
- Move and repeat. Carry the same list to a second position at the same structure, a courtyard or the opposite side, and record it again.
- Write down where you stood. An inventory that does not state the position it was taken from cannot be compared with any other.
Verify: compare the two inventories. Where they differ (a band that reads occupied from one spot and empty from the other), the difference is the structure and the street geometry rather than the equipment.
Reading the antennas
An antenna is the visible half of an emitter, so identifying one on a rooftop or a tower tells you roughly what band it works in before you sweep anything. The chain is short and it has a hard limit: the antenna's shape and size narrow the frequency band, the band narrows the likely service, and the service is confirmed only by the database lookup of Unit 07 and a sweep. The antenna's form points you toward a band, but it does not name the service.
Size is set by the wavelength an antenna works at, and wavelength by frequency. The relationship is fixed: “Wavelength (meters) = 300 ÷ Frequency (MHz).”90 A resonant element is cut to a fraction of that wavelength: a half-wave element in feet measures “468/f in MHz,”91 and on a ground-plane antenna the horizontal rods at its base, its radials, each measure “1/4 wavelength of the desired frequency.”92 The consequence is the one thing to carry away from this unit: a physically long element resonates at a low frequency and a short one at a high frequency. A 2 m whip is a VHF antenna; a hand-sized patch is a microwave one.
The omnidirectional kind radiates equally toward the horizon in every direction, and looks like a single thin vertical rod or fiberglass tube. Stacking several rod sections in one line, a collinear array, concentrates the signal toward the horizon and so increases its reach: “gain greater than unity is achieved by forming a collinear vertical array, which reduces the elevation beam width but leaves the azimuth (horizon) pattern unaffected.”89 One aimed along a single bearing is directional, and shows that aim in its shape: the parallel rungs of a Yagi, the flat face of a panel, the round face of a dish. A directional antenna on a building points to where its far end is.
A field key
These are the antennas an urban area actually carries, each read by the same two features, size and aim.
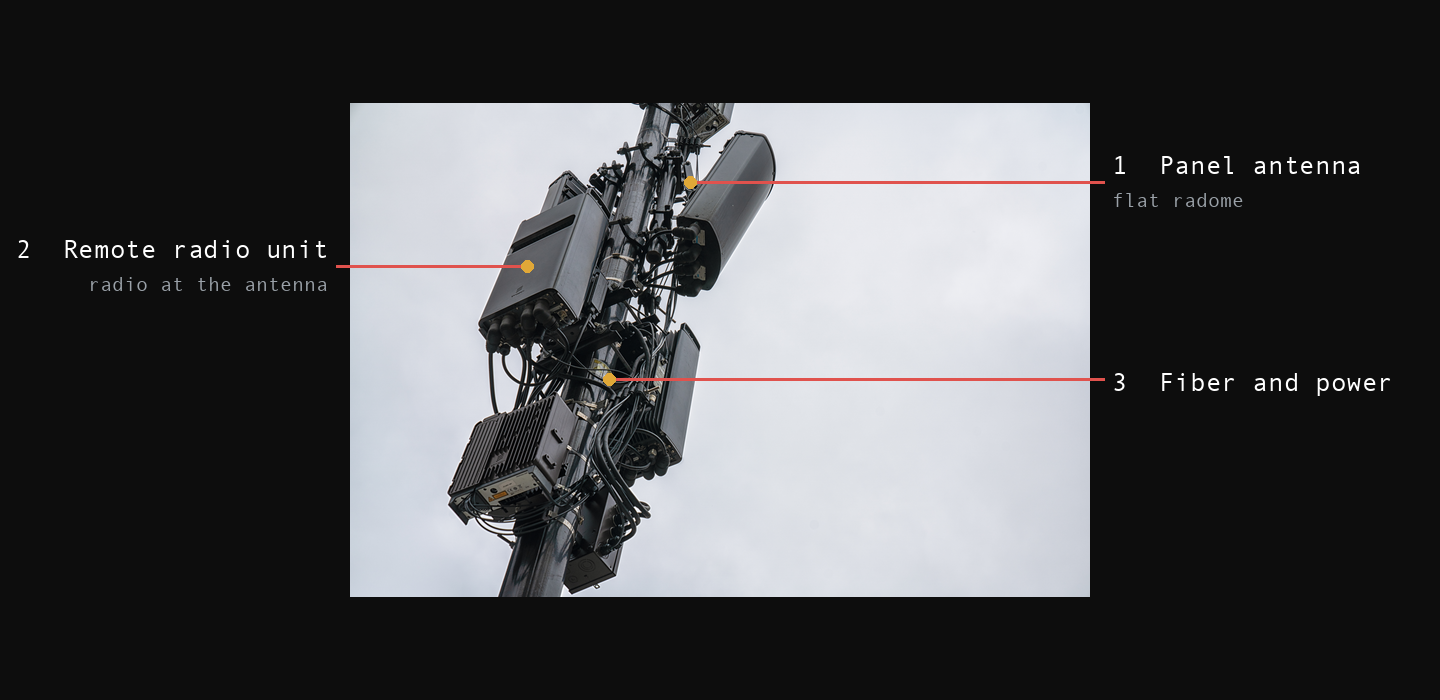
- Cellular site. Flat vertical panel antennas in their weatherproof covers, called radomes, in a cluster, each cluster aimed on one of three bearings, so a mast carries three faces looking outward. This is still the three-sector layout: a site “usually has as few as nine antennas to an antenna mast (three panel antennas per sector).”89
- The modern sign. A boxy remote radio unit now sits at the antenna rather than in a ground shelter, so a current site is a stack of panels and radios with thick fiber and power running up to them. A single active antenna covers many bands at once, so its size no longer marks one band.
- Bands. US mobile spans low-band below 1 GHz, a mid-band tier around the Citizens Broadband Radio Service at “3550-3700 MHz”95 and the C-band just above it, and millimeter-wave in the tens of GHz for dense small sites.

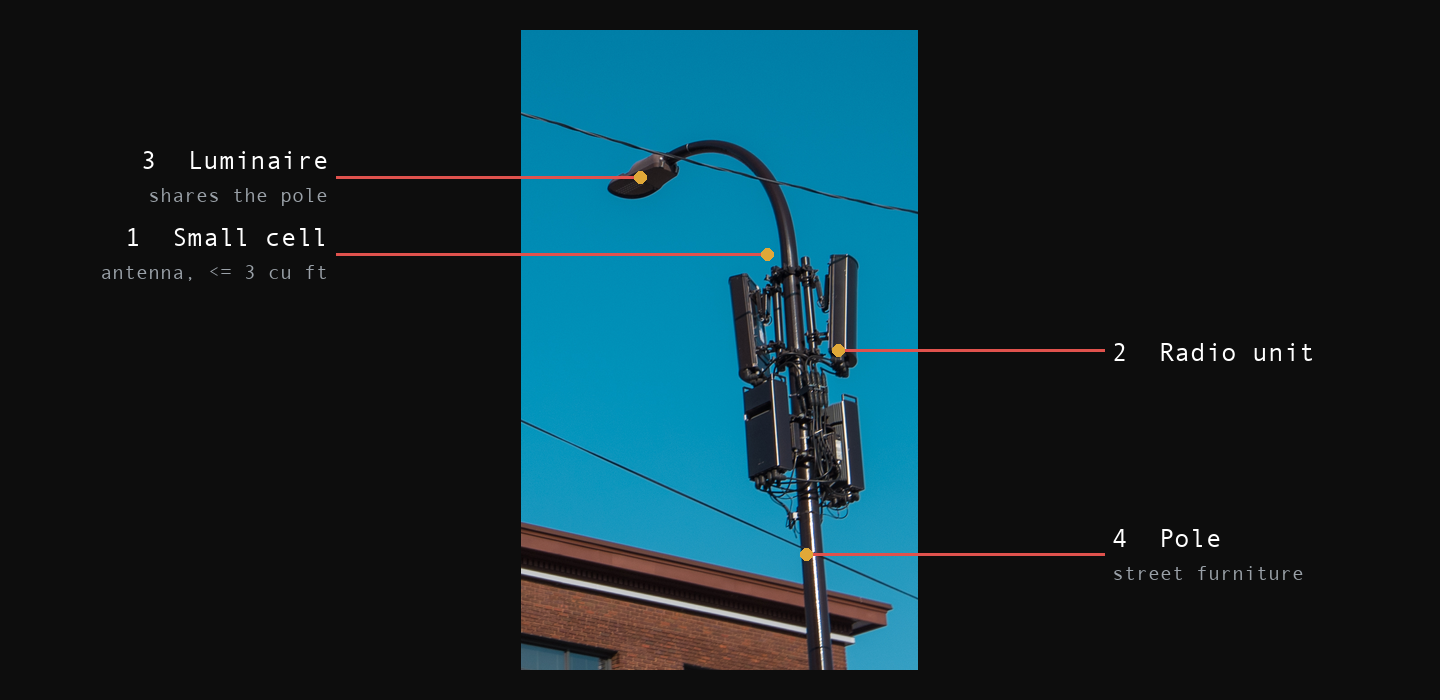
- Small cell. A short pole-top cluster of canister or slab antennas with a radio box, filling coverage a macro site cannot reach. The FCC defines the class by size: mounted on structures “50 feet or less in height including their antennas,” each antenna “no more than three cubic feet in volume.”98 The agency’s own description is “antennas often no larger than a small backpack.”98
- The sign. It is mounted on street furniture, a lamp post or a traffic-signal pole, at head height rather than on a tower. Read the pole-tops on a dense block, not just the skyline. It carries the same mid-band and millimeter-wave cellular spectrum as a macro site, close in.
.jpg)
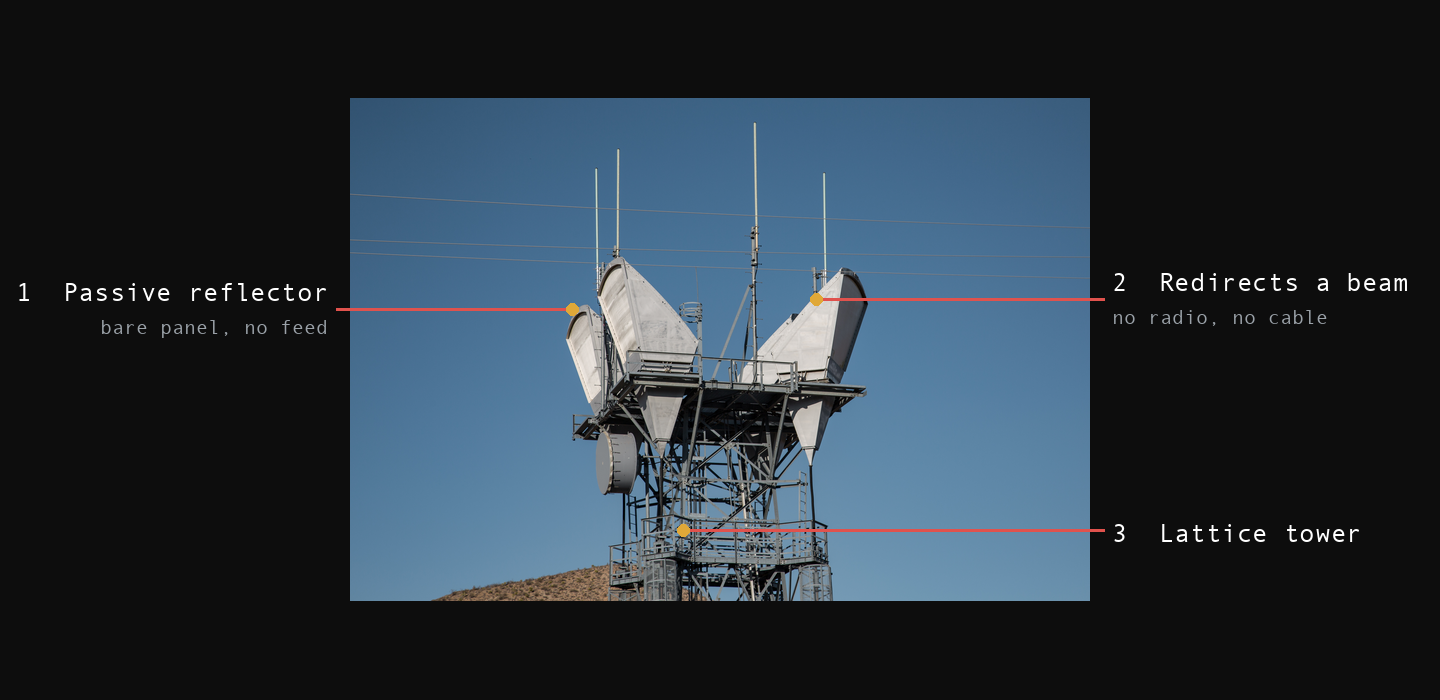
- Point-to-point backhaul. A round dish, aimed at a matching dish on the horizon, carries a licensed point-to-point link. Under Part 101 those links run in bands such as “5925-6425” and “6525-6875” MHz, “10,700-11,700” MHz, and “21,200-23,600” MHz.93
- Active dish or passive mirror. The photograph shows the common error: these are not dishes but passive reflectors, “flat surfaces of metallic material… arranged so that the angle of incoming beam corresponds to the angle of the outcoming signal.”96 Such a reflector “needs little maintenance and no on-site electric power.”96 The difference: an active dish carries a feed at its center and radio hardware and cabling behind it; a passive reflector is a bare panel with none.
.jpg)
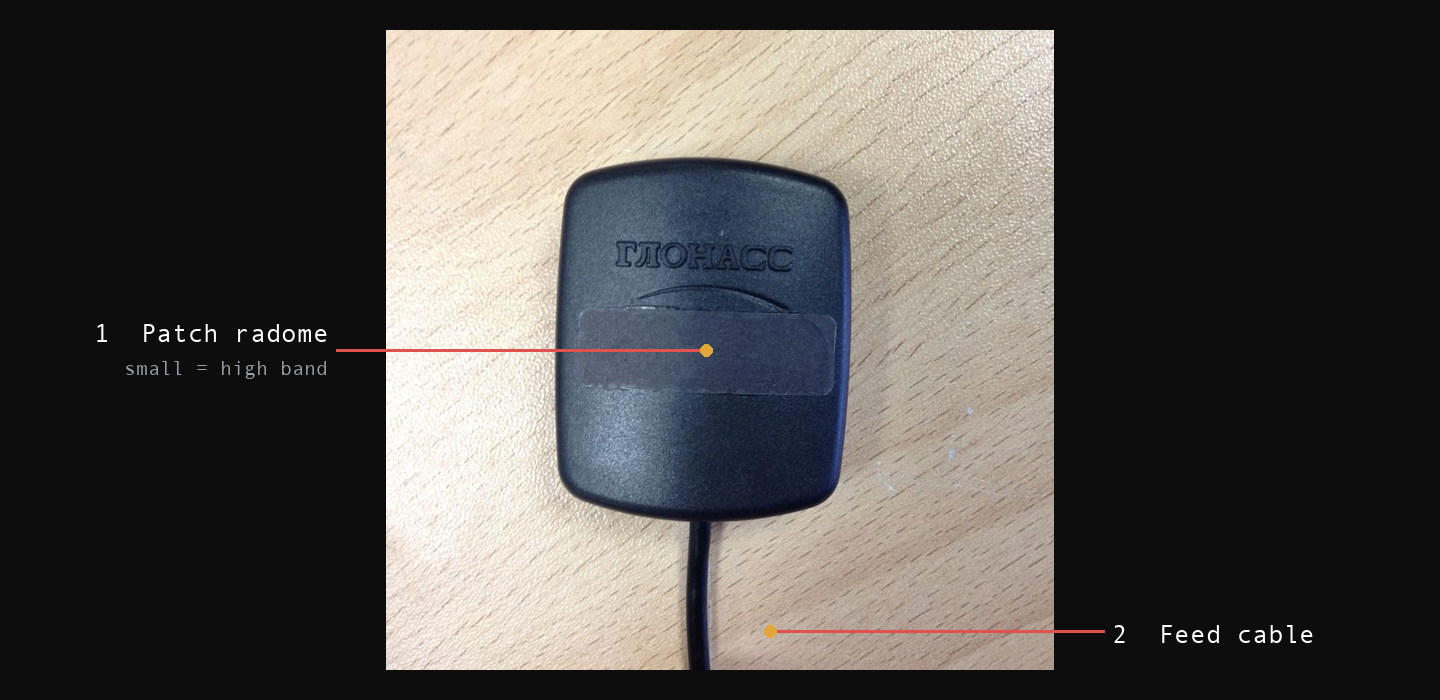
- Timing puck. A small low-profile dome or square, often on the roof of an equipment cabinet. It receives GPS, which broadcasts on “1575 MHz, or L1,” “1227 MHz, or L2,” and “1176 MHz.”94 Its small size follows the high band.
- Read. A GNSS puck means the site keeps disciplined time, which is what trunked radio, cellular, and utility systems need. It marks timing-critical infrastructure, not a link you can hear.

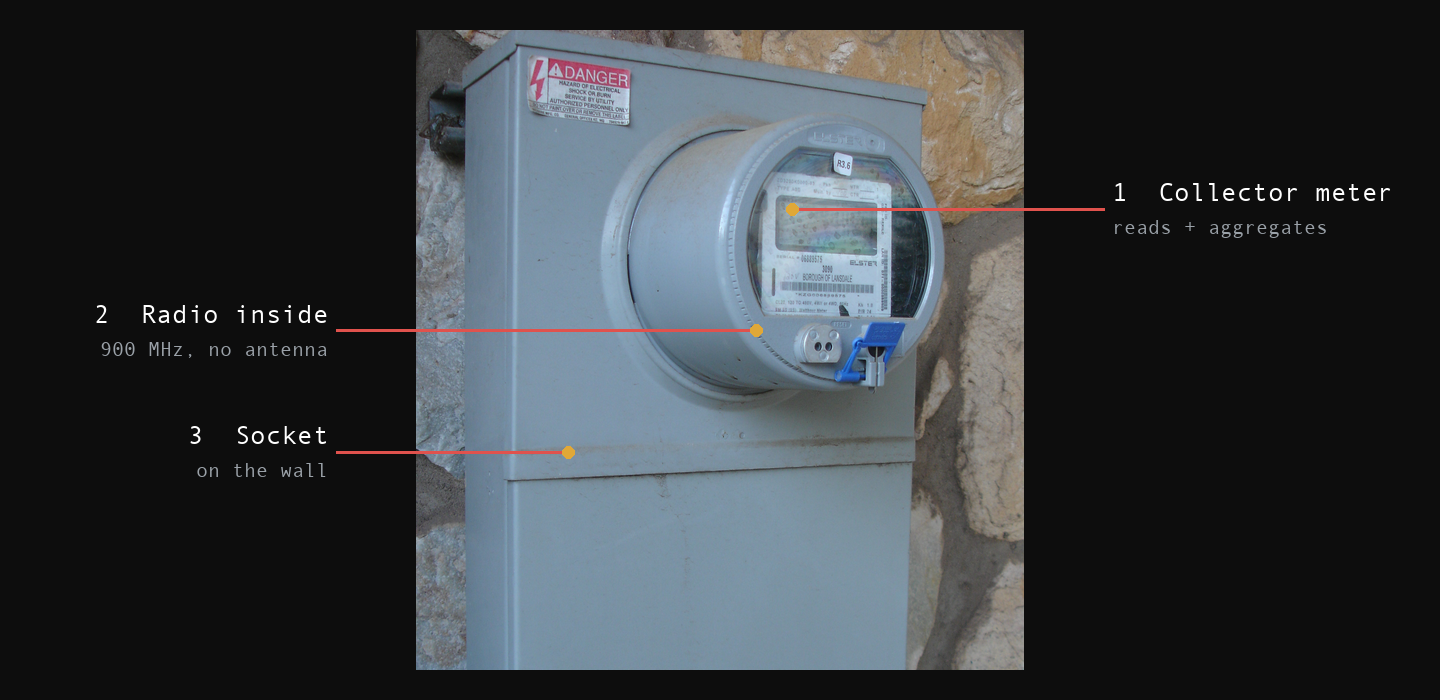
- Utility collector. The hardest to see, because there is often no antenna to see. This meter is also a collector: it “collects data from neighboring… smart meters using a 900MHz Frequency Hopping Spread Spectrum (FHSS)” to form a local sensor network.101 The radio is inside the meter, so nothing projects from the wall.
- Two forms. Some collectors are pole-mounted data-aggregation routers instead, running “900 MHz ISM Channels” on an “IEEE 802.15.4 g/e” sensor network at up to “1 Watt Maximum.”99 Either way it is the Wi-SUN field-area network for “Connecting smart electricity, water, and gas meters” in the North American “902-928MHz” band.100
- The sign. With little or nothing to see, this one is confirmed by the 900 MHz sweep of Unit 05 rather than by sight. A steady scatter of brief 900 MHz bursts across a residential block is the meter network reporting.

A few more are worth knowing without a photograph to hand. A Yagi beam is a row of parallel rods on a boom, aimed end-on; only the driven element is fed, with a longer “reflector” behind and shorter “directors” in front,88 and it serves fixed links, amateur stations, and older rooftop television, from VHF up to about 2.5 GHz. A collinear whip, a single tall fiberglass tube, is the omnidirectional base antenna of a land-mobile system, in the VHF 30 to 300 MHz or UHF 300 MHz to 3 GHz range.88 A broadcast array is a tall stack of like elements, called bays, high on a mast; FM runs “88MHz to 108MHz” and television the VHF and UHF bands.88 A Wi-Fi access point is a small dome or flat panel, indoors or on a wall, working the unlicensed 2.4, 5, and now the 6 GHz band the FCC opened across “5.925-7.125 GHz.”97
Form narrows the band, not the service. The same shape serves different owners, and bands get reassigned. Television's old UHF Band V is the plain case: the upper part, “644-890 MHz,” once carried TV, but “the upper portion has gone to LMRS (Land Mobile Radio Service) and cell phone services.”88 A UHF antenna near 700 to 800 MHz that looks like an old TV aerial may now be public safety or cellular. So the antenna gives you the band and a short list of services; RadioReference and your own sweep, from Unit 07, settle which one.
Identifying a signal
A sweep tells you a channel is busy, not what is using it. Identifying it depends on three things you can measure without decoding anything: where the signal sits, how wide it is, and how it behaves over time. A voice repeater keys up and drops again, a control channel runs continuously, and a telemetry device transmits for a fraction of a second, then is idle for minutes. Those patterns are visible in the waterfall before any demodulator is involved.
Two lookups do most of the work, and both are open-source reconnaissance in the sense of Unit 01. RadioReference records what is licensed and in use in a given place: it “is the place to find information about major radio systems in use near you, from businesses to public safety.”55 The Signal Identification Wiki works the other direction, from an unknown signal back to a name: it “can help you make sense of what kinds of signals you are receiving, with visual examples of what they might look like in an SDR waterfall, and audio clips of examples.”55 Look up the area first, then match what you actually hear against it. When a signal appears on a frequency where the database says a system operates, you have identified it well enough to confirm with one further check.
Artemis “is a software designed to assist radio frequency (RF) signal identification and storage,” carrying a database of “over 520 recognized signals” with “specific parameters such as frequency, bandwidth, modulation” alongside “spectrum waterfalls, audio samples, and all types of documents.”84 Its database is “directly sourced from the Signal Identification Wiki.”85 The program is released under the GPL-3 license,84 and holding the reference locally rather than in a browser tab matters for the same reason the open-source reconnaissance in Unit 01 happens before you arrive: identifying a signal you have just found should not require asking a website about it.
Much public-safety traffic is trunked, which changes what you are looking at. In a trunked system “all radios monitor a ‘control’ channel,” and “multiple talk groups exist on a pool of shared frequencies (fire, police, EMS, etc).”55 The continuously busy channel you found is likely the control channel, not a conversation; the conversations move across the pool under its direction. Local governments in major metropolitan areas run digital trunked systems.55
You will not be handed a labeled screenshot in the field, so the exercise below presents each signal as a measurement, the form it takes in the field. Each one gives a center frequency, an occupied bandwidth, and a behavior over time, and asks you to narrow from those three to a service. All six are things an ordinary residential block carries, and one of them is the meter Unit 02 read on the wall.
Emplacing a sensor
A single sweep records only the moment it was taken, and occupancy changes with the hour, so a band that reads clear at three in the afternoon can be full at seven the next morning. To record what a location actually carries, you leave a receiver running and measure the same channels repeatedly across a set period.
The threshold rule is the core of occupancy measurement: “if a signal is received above the threshold level, the channel is considered to be occupied.”49 The receiver repeats that test across as many channels as it can, as fast as it can. Each estimate covers an integration time, normally 5 or 15 minutes, and the whole run is the duration of monitoring, the total time the measurement is carried out. The peak matters as much as the average: the busy hour is the highest occupancy a channel reaches in any 60-minute period.49
The recommendation is specific about how long to run the capture: “if no time distribution pattern is known, initial evaluations should consider at least 24 h or multiples of 24 h,” while “one week of monitoring gives the difference in occupancy over the various days of the week.”49 A 24 to 48 hour capture is the minimum, not the ideal: it catches the daily cycle but not the difference between a Tuesday and a Sunday. Record which your baseline covers, and do not claim the other.
Coverage and resolution trade against each other, and the same recommendation gives the relationship: “revisit time = (observation time × number of channels of identical bandwidth) + processing time,” so “in order to maintain a reasonably short revisit time with relatively slow equipment, the number of channels to be measured must be reduced.”49 Sweep a wide range in coarse bins and you return to each channel often while resolving little. Narrow the range or the bins and you resolve more while returning less often. Decide which one the assessment needs before you start the run, because you cannot recover the other from the recording.
The tool is rtl_power, a “wideband spectrum monitor utility.”50 You give it a range and a bin size as -f lower:upper:bin_size, an integration interval with -i, and a run length with -e. Its output is a CSV file, a plain-text table of comma-separated values, whose columns are “date, time, Hz low, Hz high, Hz step, samples, dbm, dbm, ...”50 That file is an occupancy record in the ITU's own terms: a channel, a time, and a level to compare against a threshold. Its -i 15m option lands exactly on the integration time the ITU recommends.
# 48-hour occupancy baseline, 100 MHz to 1 GHz, 1 MHz bins,
# 15-minute integration to match the ITU integration time
rtl_power -f 100M:1G:1M -i 15m -e 48h -g 40 baseline.csv

# narrower and finer: one band, 12.5 kHz bins, same window
rtl_power -f 450M:470M:12500 -i 15m -e 48h -g 40 uhf-baseline.csv
The CSV is a table, not a picture, so render it. heatmap.py from the rtl-sdr tools will “convert rtl_power CSV files into graphics,” and its --ytick option marks the Y axis at a chosen interval,76 which turns two days of rows into a readable image with the hours down the side. If the sweep runs slowly on the sensor's small computer, rtl_power_fftw does the same job through the faster FFTW library,77 and soapy_power does it across other hardware.75
Kismet is a passive Wi-Fi, Bluetooth, and RF sniffer:51 it “identifies networks by passively collecting packets,” uncovers hidden networks given time, and detects networks that never announce themselves by reading their ordinary data traffic,52 and it is “most effective in a stationary… setup,”52 which is what an emplaced sensor is. WiGLE is its open-source counterpart, a central database of wireless networks worldwide that you can query over the web,53 so check what it already holds for a location before you go. Its terms limit reuse: WiGLE does not want the data used for “unlicensed commercial gain” and is “not currently granting commercial licenses.”53
With an rtl-sdr and the rtl_433 tool, Kismet can “collect information about RF sensors, weather stations, tire pressure monitors,… power meters, gas meters, water meters,” and more.78 The metering you read on the wall in Unit 02 is, on many installations, also transmitting, and the same node that logs spectrum occupancy records it.
The kismetdb log is “a unified common file of packets, non-packet data, devices, location, system messages, datasource records, historical trends, and almost everything else Kismet can track,”79 so a two-day run leaves a single artifact to carry away and read later rather than a directory of fragments.
Kismet “supports transparent remote capture, using the same sources that can capture locally,” so a node in the field feeds a server elsewhere.80 A fixed sensor launches its remote-capture tool with the --fixed-gps argument, which tags every packet with that location.80 A reporting node then only has to keep running, not be recovered.
Where you place the sensor decides both how much it can receive and how likely it is to be found. A remote sensor exists to give “an extended-range surveillance capability without the requirement to maintain a physical presence in the surveillance area,”54 which is the whole reason to leave one rather than sit beside it. The doctrine names the same tradeoff among its siting factors: a concealed position “provides cover and concealment for sensors and relays, but may inhibit antenna placement and interfere with communications line-of-sight,”54 so the position that conceals best often receives least, and choosing between them is the siting decision. Detection resistance is a property of the emplacement rather than the hardware: “properly emplaced remote sensors are extremely difficult to detect.”54
A survey receiver transmits nothing: the instrument “is passive, does not emit anything.”72 A sensor is therefore found by its antenna and feed line, not by its emissions. Concealing a receive antenna is a physical problem rather than an emissions problem, and it is solved by looking rather than by measuring.
The doctrine for hiding an antenna was written for transmitting stations, but its physical half transfers without change. Work the room first: “check walls and ceiling of the room for reinforcing bars or beams, metal lathe plaster, or any substance that conducts electricity,” and the field-expedient test is to “hold the compass close to the walls and ceiling to detect metallic objects,” remembering that “this procedure, however, will not detect nonmagnetic metal, so a thorough inspection must be made.”86 Steel reinforcement and foil-backed insulation turn a well-chosen room into a shielded box, and a compass finds most of it in a minute. Height helps for the same reason it helps outdoors: “select as high a floor as possible within the chosen building so other close buildings do not interfere.”86
Then hide it in what is already there. Indoors, “check the room (moldings, baseboards, and window frames) for means of concealment and support for antenna and transmission lines.”86 Outdoors, the doctrine lists the fixtures a building already offers: “exterior steps made of wood, guy wires for signs, rain gutters, or clotheslines.”86 Urban radio guidance says the same in fewer words, that an antenna can be “concealed by water towers, existing civilian antennas, or steeples.”66 The standard to work to is absolute: “ensure no evidence of the antenna, to include wire elements, transmission line, halyard, and insulators, is visible or unnatural to the location.”86 The feed line and its fixings reveal a sensor as readily as the element does, and the test is not whether the antenna is hidden but whether anything about the spot looks unnatural to someone who lives there.
A discone on a mast is the wrong antenna for an emplacement. It is the correct one for a survey, but it is a recognizable instrument mounted where instruments are not. What you emplace instead is a length of wire, and its size follows the frequency. A wavelength in metres is 300 divided by the frequency in megahertz;90 a half-wave wire element is “468/f in MHz,” in feet.91 Near 460 MHz, the UHF land-mobile band a structure usually carries, that element is about a foot; near 155 MHz in VHF it is about three feet. Anything shorter, a stub or a short whip, needs a counterpoise to work against, radials “each measuring 1/4 wavelength of the desired frequency” standing in for a ground,92 so the whip is only half of the antenna. Cut the wire for the band you most want to hear, from the ones the survey found, and accept that it hears the rest less well.
Conceal it the way the clandestine-antenna doctrine already directs, by routing the wire along what the structure offers. The fixtures the doctrine lists, “exterior steps made of wood, guy wires for signs, rain gutters, or clotheslines” outdoors and the moldings, baseboards, and window frames indoors, are named as a means to support and conceal the antenna and its transmission line,86 not as the antenna itself: you run a thin wire along the gutter or the window frame, you do not clip a lead to the gutter and call it the antenna. The wire is chosen to disappear, stranded copper of 26 to 28 AWG, “nearly invisible at 20 feet when dark-colored,” in brown, black, or dark green,102 run along a fence line or a window frame. Route it clear of the building’s own wiring, “at least 12 inches away from any household electrical cable,”102 because a receive wire run against the mains “picks up noise directly from the wiring.”102 The standard is the absolute one from the start of the unit, that “no evidence of the antenna, to include wire elements, transmission line, halyard, and insulators, is visible or unnatural to the location.”86 A discone or a whip in the open receives more and reads as an instrument; a thin wire tucked along a frame receives less and reads as nothing. Choose the antenna against the concealment the place actually gives you, and accept the loss of sensitivity as its price.
How long the sensor can keep running sets how much of the occupancy record you get, so plan the power supply before the receiver. In the sensor doctrine “battery life is the primary factor limiting sensor/relay endurance,”54 and it is the same here: a receiver and a small computer running for two days need a power source that lasts the whole run. Unit 04's tap solves it: a small computer drawing on the order of a watt40 sits far below the headroom of any circuit you measured, so a tapped supply removes the runtime ceiling a battery imposes.
Whether the computer can process the incoming data fast enough is a separate question from power, and it is worth settling before you leave a node anywhere. A Raspberry Pi Zero 2 W has a “1GHz quad-core 64-bit Arm Cortex-A53 CPU,” “512MB SDRAM,” and a single “micro USB On-The-Go (OTG) port.”81 That one bus carries the receiver's sample stream while the same board writes the log, on half a gigabyte of memory. Whether it sustains a two-day capture without dropping samples is not answerable from a datasheet or any published benchmark, so run a full-length capture on the bench before you trust one in place. A Pi 4, with a “Quad core Cortex-A72 (ARM v8) 64-bit SoC @ 1.8GHz” and “2 USB 3.0 ports,”82 removes both of those limits, giving the receiver its own bus and more memory, and draws more power. Read the rtl_power_fftw remark about “simple processors such as raspberryPi”77 in its own context: that project dates from 2015, years before the Zero 2 W existed, so it is not a statement about that board.
On the ANTSDR E200 “the processing system (PS, or CPU) is running a custom-build buildroot Linux operating system,”83 so the radio and the capture host are one device on an Ethernet drop rather than a dongle tethered to a separate board.
Dolos is a different tool and should not be mistaken for this one. The series scopes it as a platform that senses, deceives, actuates, and communicates, and the instance built in Module 03 is a tamper sensor with a relay and a buzzer: a trigger and a decoy. It is not a spectrum-capture host, and nothing here asks it to be. Size any load you emplace the same way regardless of what it is, against the headroom you read at the panel.
Field exercise
Task: Assess the place you live and its block across every domain this module reads: the power service, the meter, the panel, the antennas, and the RF spectrum. Turn the readings into a baseline, a dated record of what is normal for the site, so a later change stands out against it.
Condition: Given the home, apartment, or block where you live, open sources (a mapping service, the serving utility's outage map, and the local assessor's records), a clamp meter and a multimeter, and a receiver with an antenna. Work only where you have every right to be, and touch nothing you are not permitted to touch.
Standard, core (no radio equipment needed): The serving utility named and the feed traced from open sources; the service called overhead or underground, the meter's type and state read, and the service point located from outside; the main disconnect rating read at the panel with the cover on and one branch circuit's headroom computed with the clamp meter; and the antennas visible on the structure and the block identified to a band by their form. Every reader completes the core.
Standard, extension (with the receiver and antenna from Unit 05): A sweep run and the bands present inventoried, with at least three signals identified by frequency, bandwidth, and behavior, each confirmed against RadioReference for the area or worked back to a name on the Signal Identification Wiki;55 and, with the logging setup from Unit 08, an occupancy capture of at least 24 to 48 hours recorded, with the window it covers stated and not generalized beyond.49 Add the extension when the kit is in hand; the core baseline stands on its own until then. Every stage photographed as you go, and every reading dated and set down with its photographs so the whole forms one baseline of the site you can measure a later change against.
Module test
Task: Complete the Module 07 test.
Condition: Given ten questions covering units one through eight, without reference to the module units or notes.
Standard: Answer at least eight of ten questions correctly. For each question missed, reread the unit named in the feedback and retake the test until the standard is met.
Glossary
- AMI (advanced metering infrastructure)
- A smart-meter system that records consumption in short intervals and often carries its own 900 MHz radio, so there is no separate antenna on the wall.
- Bandwidth
- How wide a signal is in frequency; on an FFT, the width of the peak that stands above the noise floor.
- Branch circuit
- A circuit downstream of the main disconnect, protected by its own breaker; the breaker rating (15, 20, 30, 40, or 50 amperes) is the circuit's ceiling.
- Control channel
- In a trunked system, the continuously busy channel that directs traffic; the conversations move across a pool of other frequencies under it.
- Discone
- A wideband antenna, a disc above a sloping cone, with usable response across a wide range of frequencies rather than at one, which is why it suits a survey.
- Fam
- The median man-made noise figure: how far a location's man-made noise sits above the quiet baseline at a given frequency. Highest in the low bands, falling as frequency rises.
- FFT
- A view of signal strength against frequency at one moment; a peak above the noise floor is an occupied channel, a stretch near the floor is open.
- Headroom
- The spare capacity left on a circuit below its limit; a continuous load should stay at or below 80 percent of the breaker rating.
- Kh constant
- The meter constant on an analog meter: the watt-hours registered per revolution of the disc (for example 3.6 or 10.0).
- Main disconnect
- The service-size breaker at the top of the panel; its ampere rating is the ceiling on what the whole structure can draw.
- Medium voltage
- Distribution voltage above 1 kV; the primary side feeding a structure is typically 12 to 34.5 kV, and is lethal and utility-only.
- Noise floor
- The background level of radio energy beneath the individual signals; a signal is detectable only when it rises above it.
- Occupancy baseline
- A spectrum capture run over at least 24 to 48 hours, showing which bands carry traffic and when; a full week shows weekday against weekend.
- Open-source reconnaissance (OSINT)
- The public records anyone can pull before going near a site: mapping imagery, utility service and outage data, and assessor and permit records.
- Service drop
- The overhead service conductors from the last pole to the building; the buried equivalent is the service lateral.
- Service point
- The boundary where the utility's conductors meet the premises wiring: the demarcation between what the utility owns and what the structure owns.
- Small cell
- A cellular antenna and radio shrunk onto street furniture, a lamp post or a signal pole at head height, carrying the same spectrum as a macro site.
- Supply-side connection
- A connection made ahead of the meter; it is unmetered and, with no breaker between it and the transformer, more dangerous than a load-side tap.
- Trunked system
- A radio system in which talk groups share a pool of frequencies directed by a control channel; common for metropolitan public-safety traffic.
- Waterfall
- A view of the same frequencies stacked over time, so a signal's behavior, constant or bursting, is visible before any demodulation.
- Weatherhead (masthead)
- The fitting that caps the service mast where an overhead drop lands; the conductors hang below it in drip loops so water drips off before it can run into the conduit.
Sources
- National Electrical Code (NFPA 70), §230.79 “Rating of Service Disconnecting Means,” 2005 ed. Full text via Public.Resource.Org, archive.org.
- National Electrical Code (NFPA 70), §210.3 “Branch circuits — Rating,” 2005 ed.
- InterNACHI, Standards of Practice (§3.7 Electrical) and “Inspecting the Main Electrical Panelboard.” Via the Wayback Machine, web.archive.org.
- US Army Engineer Course, Electricity VII — Install Circuit Protective Devices (EN5146). US Government work, public domain.
- US Army Engineer Course, Electricity IV — Install Conduit Systems (EN5143). US Government work, public domain.
- Recommendation ITU-R P.372 (Radio noise), man-made noise median curves (city and business-area fits). International Telecommunication Union.
- Fluke, “ABCs of Clamp Meters” and “Inside Current Transformer (ac) Clamp Meters,” fluke.com.
- IoTaWatt, Open WiFi Electric Power Monitor, iotawatt.com (open-source hardware + firmware).
- OpenEnergyMonitor, “CT Sensors — Introduction,” docs.openenergymonitor.org (open-source energy monitoring).
- RTL-SDR Blog V4 Datasheet v1.0 (2024), rtl-sdr.com.
- Great Scott Gadgets, HackRF One, greatscottgadgets.com (open-source hardware).
- tinySA, Specification, tinysa.org (open-hardware spectrum analyzer).
- SDR++ User Guide (v1.1, 2022) and sdrpp.org (open-source SDR software).
- Gqrx SDR, gqrx.dk (GNU GPL, GNU Radio-based SDR receiver).
- National Electrical Code (NFPA 70), §210.19(A)(1) and §210.20(A) (continuous-load sizing: 125 percent of the continuous load), 2005 ed. Full text via Public.Resource.Org, archive.org.
- National Electrical Code (NFPA 70), §210.12 (arc-fault protection) and §210.8 (ground-fault protection for personnel), 2005 ed.
- InterNACHI, How to Perform Residential Electrical Inspections, 4th ed. (2013) — service entrance, mast and masthead, 120/240 cable assembly, service-conductor sizing, and distribution (sub-) panels. Via the Wayback Machine.
- InterNACHI, “Ground-Fault Circuit Interrupters (GFCIs).” Via the Wayback Machine.
- FCC, Title 47 CFR §15.107 “Conducted limits” (radio-frequency voltage conducted onto the AC power line, 150 kHz to 30 MHz; battery-only exemption). Via Cornell Law LII, law.cornell.edu.
- U.S. Energy Information Administration, “An Assessment of Interval Data and Their Potential Application to Residential Electricity End-Use Modeling,” eia.gov.
- When the Power Goes Out (2007): generator connection and transfer switches. Light Fighter Library.
- National Electrical Code (NFPA 70), §705.10 “Directory” and §705.12 “Point of Connection” (interconnected electric power production sources), 2005 ed. Full text via Public.Resource.Org, archive.org.
- National Electrical Code (NFPA 70), §702.2 (optional standby systems, definition) and §702.6 “Transfer Equipment,” 2005 ed.
- National Electrical Code (NFPA 70), Article 100 Definitions, “Service,” 2005 ed. Full text via Public.Resource.Org, archive.org.
- US Army, TM 5-682, Facilities Engineering: Electrical Facilities Safety (de-energizing and verifying a circuit dead; job preparation and protective equipment). US Government work, public domain.
- National Electrical Code (NFPA 70), §110.14(B) “Splices,” 2005 ed.
- National Electrical Code (NFPA 70), §300.15 (box installed at each splice, outlet, or junction point), 2005 ed.
- National Electrical Code (NFPA 70), §240.4 (protection of conductors in accordance with their ampacities) and §400.5 (flexible cord and cable ampacity), 2005 ed.
- National Electrical Code (NFPA 70), Article 100 Definitions: “Service Point,” “Service Drop,” “Service Lateral,” and “Service Equipment,” 2005 ed. Full text via Public.Resource.Org, archive.org.
- US Army, TM 5-811-1, Electrical Power Supply and Distribution (primary distribution voltage class; riser-pole fuse cutouts and surge arresters). US Government work, public domain.
- National Electrical Code (NFPA 70), §550.32(A) (mobile-home service-equipment location), 2005 ed.
- U.S. Fire Administration (FEMA), Basic Evaluation Procedures for Abandoned and Vacant Buildings (April 2018) — exterior survey, observing utility-meter status. US Government work, public domain. usfa.fema.gov.
- “Electricity meter,” Wikipedia (electromechanical induction meter: disc speed proportional to power; meter constant Kh in watt-hours per revolution), en.wikipedia.org.
- OpenStreetMap Wiki, “Key:power” (grid infrastructure tagging: line, minor_line, tower, pole, transformer, substation), wiki.openstreetmap.org. Data licensed under the Open Database License (ODbL).
- Open Infrastructure Map, “About” (a view of the world's infrastructure from OpenStreetMap data), openinframap.org.
- Library of Congress, Sanborn Maps Collection (public-domain fire-insurance maps: building footprint and construction), loc.gov.
- National Electrical Code (NFPA 70), §230.82 “Equipment Connected to the Supply Side of Service Disconnect,” 2005 ed. Full text via Public.Resource.Org, archive.org.
- OSHA, 29 CFR §1910.269(g)(2) “Fall protection” (personal fall arrest, work-positioning, or fall restraint above 1.2 m / 4 ft on poles and towers). Via Cornell Law LII, law.cornell.edu.
- OSHA, 29 CFR §1910.137 “Electrical protective equipment” (rubber insulating gloves; Table I-4 class and maximum use voltage). Via Cornell Law LII, law.cornell.edu.
- Jeff Geerling, Raspberry Pi Dramble, “Power Consumption Benchmarks” (Raspberry Pi Zero 2 W idle, 100 mA / 0.6 W), pidramble.com.
- OpenStreetMap Wiki, “Tag:power=substation” (substation definition;
voltageordered highest to lowest), wiki.openstreetmap.org. - OpenStreetMap Wiki, “Overpass API/Overpass QL” (the
aroundradius filter;nwrshorthand), wiki.openstreetmap.org. - OpenStreetMap Wiki, “Tag:man_made=street_cabinet” (street cabinets;
utility=power), wiki.openstreetmap.org. - OpenStreetMap Wiki, “Tag:power=generator” (generator definition;
generator:source), wiki.openstreetmap.org. - Florida Power & Light, “Power Tracker Map FAQ” (what the outage map shows; no street-address detail), fpl.com.
- Orange & Rockland Utilities, “Outage Map FAQ” (outage symbol placed at a center point; update interval), oru.com.
- Homeland Infrastructure Foundation-Level Data (HIFLD), “Electric Power Transmission Lines,” via catalog.data.gov. US Government work.
- Homeland Security Digital Library, “HIFLD” (August 2025 shutdown of the HIFLD Open portal; datasets preserved in HSDL), hsdl.org.
- Recommendation ITU-R SM.1880-2 (09/2017), “Spectrum occupancy measurement and evaluation” (threshold method; integration time; duration of monitoring; busy hour; revisit time). International Telecommunication Union, itu.int.
- rtl_power(1) man page, osmocom rtl-sdr project (wideband spectrum monitor;
-f/-i/-eoptions; CSV output columns), manpages.debian.org. - Kismet, project home page (sniffer, WIDS and wardriving tool for Wi-Fi, Bluetooth, Zigbee and RF), kismetwireless.net.
- US Army Special Forces Command (Airborne), Introduction to Aircrack-ng and Kismet (passive collection; stationary versus wardriving use). Light Fighter Library.
- WiGLE, “Frequently Asked Questions” (consolidated database of wireless networks; reuse and commercial-licensing terms), wigle.net.
- US Marine Corps, MCRP 2-24B, Remote Sensor Operations (remote surveillance without physical presence; siting factors; stealth; battery life as the endurance limit). US Government work, public domain. Light Fighter Library.
- Noah Axon, Introduction to Software Defined Radio supplement, rev 0.9.1 (2024-05-05) — SigIDWiki and RadioReference as lookup references; trunked-system control channel; civilian scanning and its legal caveats. Light Fighter Homefront course material.
- 18 U.S.C. §2510(16), definition of “readily accessible to the general public” (excludes scrambled or encrypted communications). Via Cornell Law LII, law.cornell.edu.
- 18 U.S.C. §2511(2)(g), lawful interception of radio readily accessible to the general public, including public-safety, amateur, citizens band, GMRS, marine and aeronautical systems. Via Cornell Law LII, law.cornell.edu.
- 47 U.S.C. §605(a), Communications Act (prohibition on divulging or publishing intercepted communications, and its exception for general-public, distress, amateur and citizens band radio). Via Cornell Law LII, law.cornell.edu.
- 47 CFR §2.106, Table of Frequency Allocations (US allocation authority; FM broadcasting in the band 88-108 MHz). Via Cornell Law LII, law.cornell.edu.
- 47 CFR §87.173, Aviation Services frequencies (VHF omni-range, ILS localizer, air traffic control channels, 121.500 MHz emergency and distress). Via Cornell Law LII, law.cornell.edu.
- 47 CFR §80.373, Maritime Services VHF frequencies. Via Cornell Law LII, law.cornell.edu.
- 47 CFR Part 95, Personal Radio Services: §95.563 (FRS channels) and §95.2763 (MURS channels). Via Cornell Law LII, law.cornell.edu.
- 47 CFR §97.301, Amateur Radio Service authorized frequency bands. Via Cornell Law LII, law.cornell.edu.
- 47 CFR §15.247, unlicensed operation within the bands 902-928 MHz, 2400-2483.5 MHz, and 5725-5850 MHz. Via Cornell Law LII, law.cornell.edu.
- 47 CFR §90.20, Public Safety Pool (Private Land Mobile Radio Services). Via Cornell Law LII, law.cornell.edu.
- US Army, FM 24-18, Tactical Single-Channel Radio Communications Techniques (1987), §7-18 Radio Communications in Urbanized Terrain. US Government work, public domain. Light Fighter Library.
- Light Fighter Homefront course material, RF Intelligence for Drone and Communication Operations in Urban Environments (urban versus rural noise-floor levels). Light Fighter Library.
- tinySA Ultra (tinySA4) Specification — frequency coverage, resolution filters, input attenuation, battery. tinysa.org.
- tinySA, “Ultra mode” — low-pass filter bypass above roughly 800 MHz, calibrated level range, and sensitivity roll-off with frequency. tinysa.org.
- MicroPhase, ANTSDR E200 RF parameters (AD9361/3 variants; 70 MHz to 6.0 GHz receive; 56 MHz bandwidth; ZYNQ XC7Z020). antsdr-docs.microphase.cn.
- Airspy R2 product specification, airspy.com.
- Sergey Beskrestnov, Practical Application of the Spectrum Analyzer tinySA Ultra (Ground Forces Training Command, Kyiv, October 2023) — the instrument is passive and emits nothing; battery endurance and external power; internal LNA versus an external amplifier; 50-ohm SMA input and antenna polarization. Light Fighter Library. Cited for instrument handling only.
- SDRplay RSPdx product specification, sdrplay.com.
- Ettus Research, USRP B200 product page, ettus.com.
- soapy_power, “Obtain power spectrum from SoapySDR devices,” github.com/xmikos/soapy_power.
- heatmap.py, rtl-sdr-misc tools (renders rtl_power CSV sweeps into heatmap images), github.com/keenerd/rtl-sdr-misc.
- rtl-power-fftw (FFTW-based power spectrum from RTL devices; GPL-3.0), github.com/AD-Vega/rtl-power-fftw.
- Kismet documentation, “Sensor — SDR rtl_433” datasource, kismetwireless.net.
- Kismet documentation, “Kismetdb” log format, kismetwireless.net.
- Kismet documentation, “Remote Capture” (transparent remote capture; --fixed-gps for fixed sensors), kismetwireless.net.
- Raspberry Pi Zero 2 W product specification (Cortex-A53, 512MB SDRAM, single micro USB OTG port), raspberrypi.com.
- Raspberry Pi 4 Model B specifications (Cortex-A72 at 1.8GHz; 2 USB 3.0 and 2 USB 2.0 ports), raspberrypi.com.
- MicroPhase, ANTSDR E200 Getting Started Guide (the processing system runs a buildroot Linux operating system), antsdr-doc-en.readthedocs.io.
- AresValley, Artemis (RF signal identification and storage; GPL-3), github.com/AresValley/Artemis and aresvalley.github.io/Artemis.
- Artemis documentation, “SigID database” (sourced from the Signal Identification Wiki), aresvalley.github.io.
- US Army, STP 31-18E34, Special Forces Communications Sergeant, Skill Levels 3 and 4, task 331-18E-3042 “Construct a Clandestine Antenna” (site and room selection, checking for conductive structure, concealment in existing fixtures). US Government work, public domain. Light Fighter Library. Written for transmitting stations; cited here for physical concealment only.
- Aclara (Hubbell), Aclara I-210+ Smart Grid Meter, specification sheet ACL-PID12662472-SPEC-EN, rev. 7/2025. hubbellcdn.com. Current Rating “Class 20, 200, and 320 A”; Available Forms “CL200 : 1S, 2S, 12S, 25S”; “Compliant with ANSI C12.1, C12.10, C12.20, C37.90.1 standards.” Manufacturer datasheet for the meter photographed in Unit 02.
- US Army Electronic Warfare NCO Course, Commercial Antenna Types (Fort Sill; references MCRP 3-40.3C Antenna Handbook, MCWP 3-40.3B Radio Operator’s Handbook, NAVEDTRA 14183/14189). US Government work, public domain. Light Fighter Library. Yagi element roles, “general purpose” use to 2.5 GHz; FM “88MHz to 108MHz”; television VHF/UHF and the note that UHF Band V’s “644-890 MHz… upper portion has gone to LMRS (Land Mobile Radio Service) and cell phone services”; VHF/UHF range definitions.
- US Army, Electronic Warfare Fundamentals Student Guide, Volume I: Radio Fundamentals. US Government work, public domain. Light Fighter Library. Omnidirectional collinear vertical array; sectored cellular sites “as few as nine antennas to an antenna mast (three panel antennas per sector).”
- US Army SIGINT/SOF, RF Theory and Antenna Fundamentals (3-Day Course). Light Fighter Library. “Wavelength (meters) = 300 ÷ Frequency (MHz).”
- US Army SOF, Simple Wire HF Antenna. Light Fighter Library. Half-wave dipole length in feet, “468/f in MHz.”
- US Army Special Warfare SIGINT Course, RF Theory Read Ahead: Fundamentals of Electricity. Light Fighter Library. Ground-plane radials “each measuring 1/4 wavelength of the desired frequency”; patch antenna form.
- 47 CFR 101.101, Frequency availability (fixed point-to-point microwave, Part 101), via the Cornell Legal Information Institute, law.cornell.edu/cfr/text/47/101.101. Common-carrier point-to-point bands including “5925-6425,” “6525-6875,” “10,700-11,700,” and “21,200-23,600” MHz.
- National Coordination Office for Space-Based PNT, New Civil Signals, gps.gov/new-civil-signals. GPS carrier frequencies “1575 MHz, or L1,” “1227 MHz, or L2,” and “1176 MHz” (L5).
- 47 CFR 96.11, Frequencies (Citizens Broadband Radio Service), via the Cornell Legal Information Institute, law.cornell.edu/cfr/text/47/96.11. “The Citizens Broadband Radio Service is authorized in the 3550-3700 MHz frequency band.”
- Passive repeater, Wikipedia, en.wikipedia.org/wiki/Passive_repeater. Flat billboard reflector: “flat surfaces of metallic material… arranged so that the angle of incoming beam corresponds to the angle of the outcoming signal”; a passive repeater “needs little maintenance and no on-site electric power.” Aggregator source, used for the reflector mechanism only.
- 47 CFR 15.407, General technical requirements (Unlicensed National Information Infrastructure devices), via the Cornell Legal Information Institute, law.cornell.edu/cfr/text/47/15.407. Unlicensed 6 GHz operation across the “5.925-7.125 GHz band.”
- Ham Radio Base (Ham CQ DX), Build an Attic & Stealth Dipole Antenna: HOA and Apartment Guide, hamradiobase.com. Stealth wire selection, “#26–28 AWG stranded copper: nearly invisible at 20 feet when dark-colored” in “brown, black, and dark green”; routing “at least 12 inches away from any household electrical cable (Romex, conduit)” because close routing “picks up noise directly from the wiring”; and a wire “running along a 6-foot wooden privacy fence.” Amateur transmit guide; cited here for receive-antenna concealment and noise routing only.
- FCC 18-133, Accelerating Wireless Broadband Deployment by Removing Barriers to Infrastructure Investment, Declaratory Ruling and Third Report and Order, WT Docket 17-79, released 2018-09-27. docs.fcc.gov. Small wireless facility: mounted on structures “50 feet or less in height including their antennas,” each antenna “no more than three cubic feet in volume” (para. 9); small cells have “antennas often no larger than a small backpack” (para. 3). The controlling federal definition as of 2026.
- Itron, OpenWay Riva Adaptive Communications Technology Module for the Cisco Connected Grid Router, datasheet 101391SP-02, 2016. na.itron.com. “RF Operational Bands 900 MHz ISM Channels”; “RF links implement IEEE 802.15.4 g/e standard”; “RF Output Power 1 Watt Maximum”; a “custom mounting bracket that integrates with the CGR1240 pole mount kit.” Manufacturer datasheet for a utility RF-mesh collector.
- Wi-SUN Alliance, Wi-SUN FAN FAQ, wi-sun.org/faqs. Field Area Networks “provide a communications infrastructure for very large-scale outdoor networks” for “Connecting smart electricity, water, and gas meters”; North America band “902-928MHz.”
- Elster A3 Alpha Type A30 electricity meter collector, photograph and description by Zuzu, Wikimedia Commons, CC BY-SA 3.0. Identified as a “smart meter / collector” that “collects data from neighboring REX smart meters using a 900MHz Frequency Hopping Spread Spectrum (FHSS)… mesh network.”